100 Biggest Cities In South Carolina For 2023
Using the latest Census data, we detail the 100 biggest cities in South Carolina. You can all see a comprehensive list of all 238 cities and places in South Carolina.

We all love the biggest cities that the Palmetto State has to offer. You know the places like Charleston and Columbia which make all the headlines.
But there are a bunch of other great large cities in South Carolina that don't get as much love.
We're going to change that right now.
Using the most recent Census data, we can tell you about all the places in South Carolina with a focus on the biggest. We update the data each year and this is our fourth time doing this.
Table Of Contents: Top Ten | Methodology | Table
The Largest Cities In South Carolina For 2023:
You can click here to see a full table of the full of the 100 biggest cities in South Carolina, along with every other place over 1,000 people big. It is sortable by clicking on the headers.
Read on below to see more on the biggest cities. Or for more reading on places to live in South Carolina, check out:
- Best Places To Live In South Carolina
- Cheapest Places To Live In South Carolina
- Most Dangerous Cities In South Carolina
The 10 Biggest Cities In South Carolina
/10
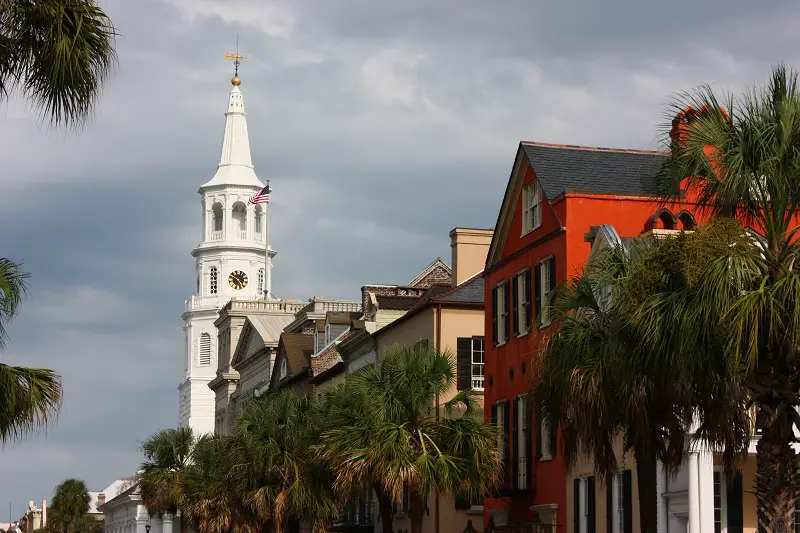
Rank Last Year: 1 (No Change)
Population: 147,928
Population 2010: 116,347
Growth: 27.1%
More on Charleston: Data | Crime | Cost Of Living | Real Estate
/10
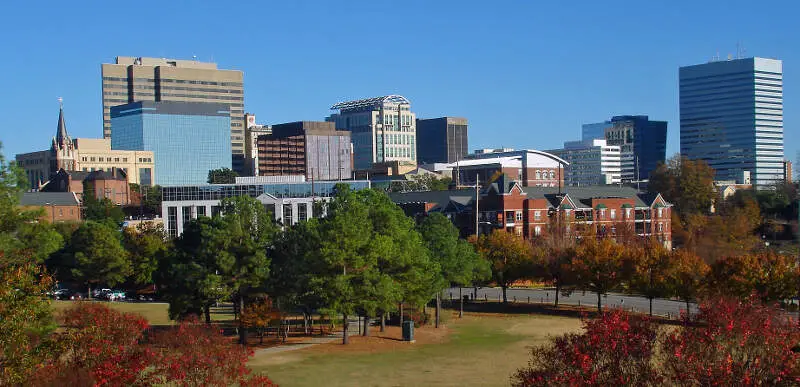
Rank Last Year: 2 (No Change)
Population: 137,276
Population 2010: 127,605
Growth: 7.6%
More on Columbia: Data | Crime | Cost Of Living | Real Estate
/10
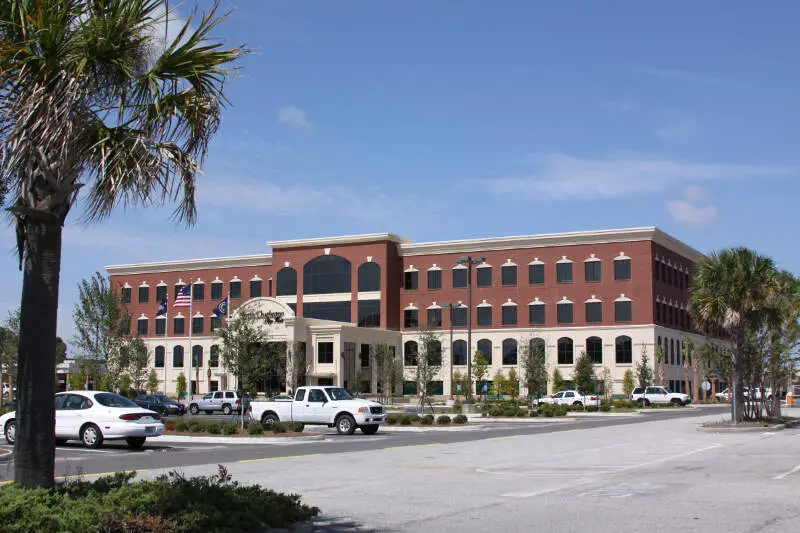
Rank Last Year: 3 (No Change)
Population: 114,542
Population 2010: 94,524
Growth: 21.2%
More on North Charleston: Data | Crime | Cost Of Living | Real Estate
/10
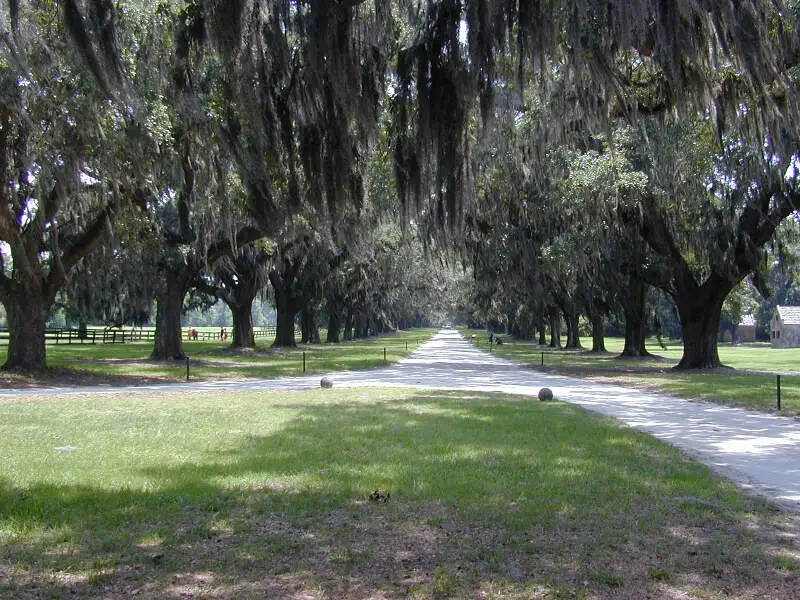
Rank Last Year: 4 (No Change)
Population: 88,900
Population 2010: 64,208
Growth: 38.5%
More on Mount Pleasant: Data | Crime | Cost Of Living | Real Estate
/10
Rank Last Year: 5 (No Change)
Population: 72,883
Population 2010: 63,108
Growth: 15.5%
More on Rock Hill: Data | Crime | Cost Of Living | Real Estate
/10
Rank Last Year: 6 (No Change)
Population: 69,725
Population 2010: 57,821
Growth: 20.6%
More on Greenville: Data | Crime | Cost Of Living | Real Estate
/10
Rank Last Year: 7 (No Change)
Population: 50,318
Population 2010: 40,409
Growth: 24.5%
More on Summerville: Data | Crime | Cost Of Living | Real Estate

/10
Rank Last Year: 8 (No Change)
Population: 44,502
Population 2010: 34,765
Growth: 28.0%
More on Goose Creek: Data | Crime | Cost Of Living | Real Estate
/10
Rank Last Year: 10 (Up 1)
Population: 42,920
Population 2010: 40,340
Growth: 6.4%
More on Sumter: Data | Crime | Cost Of Living | Real Estate
/10
Rank Last Year: 11 (Up 1)
Population: 39,816
Population 2010: 36,017
Growth: 10.5%
More on Florence: Data | Crime | Cost Of Living | Real Estate
How We Determined The Largest Cities In South Carolina
We've been ranking and dissecting cities in the Palmetto State for over 4 years now -- making this actually the fourth time we've run the numbers. We always use the best data, the US Census. In this case, that means we are using the American Community Survey.
It what is probably the most simple analysis we run each year, we ranked every place in South Carolina from biggest to smallest. The biggest city this year? That would be Charleston.
The smallest? Santee, although there are places smaller than 1,000 people not listed here, so keep that in mind as we take a look at the top ten.
Now on to numbers 11-100 Biggest in South Carolina
We hope that you find the big city, or really any city, that's right for you. Below is a list of the rest of the biggest cities along with every other place in South Carolina.
Have fun snacking around in the Palmetto State!
For more reading on South Carolina, check out:
- Best Places To Raise A Family In South Carolina
- Best Places To Retire In South Carolina
- Richest Cities In South Carolina
- Safest Places In South Carolina
- Worst Places To Live In South Carolina
- Most Expensive Places To Live In South Carolina
Detailed List Of The Biggest Cities In South Carolina
| Rank | City | Current Population | 2010 | Growth | |||||
|---|---|---|---|---|---|---|---|---|---|
| 1 | Charleston | 147,928 | 116,347 | 27.1% | |||||
| 2 | Columbia | 137,276 | 127,605 | 7.6% | |||||
| 3 | North Charleston | 114,542 | 94,524 | 21.2% | |||||
| 4 | Mount Pleasant | 88,900 | 64,208 | 38.5% | |||||
| 5 | Rock Hill | 72,883 | 63,108 | 15.5% | |||||
| 6 | Greenville | 69,725 | 57,821 | 20.6% | |||||
| 7 | Summerville | 50,318 | 40,409 | 24.5% | |||||
| 8 | Goose Creek | 44,502 | 34,765 | 28.0% | |||||
| 9 | Sumter | 42,920 | 40,340 | 6.4% | |||||
| 10 | Florence | 39,816 | 36,017 | 10.5% | |||||
| 11 | Hilton Head Island | 38,068 | 36,714 | 3.7% | |||||
| 12 | Spartanburg | 37,990 | 37,488 | 1.3% | |||||
| 13 | Greer | 35,151 | 23,908 | 47.0% | |||||
| 14 | Myrtle Beach | 35,116 | 26,696 | 31.5% | |||||
| 15 | Aiken | 31,516 | 28,807 | 9.4% | |||||
| 16 | Anderson | 28,796 | 26,566 | 8.4% | |||||
| 17 | Bluffton | 27,596 | 10,748 | 156.8% | |||||
| 18 | Mauldin | 24,735 | 21,686 | 14.1% | |||||
| 19 | Socastee | 24,657 | 17,108 | 44.1% | |||||
| 20 | Fort Mill | 24,069 | 10,273 | 134.3% | |||||
| 21 | North Augusta | 24,013 | 20,535 | 16.9% | |||||
| 22 | Taylors | 23,348 | 21,635 | 7.9% | |||||
| 23 | Simpsonville | 23,190 | 17,537 | 32.2% | |||||
| 24 | Lexington | 23,068 | 16,410 | 40.6% | |||||
| 25 | Easley | 22,643 | 19,720 | 14.8% | |||||
| 26 | Greenwood | 22,363 | 22,936 | -2.5% | |||||
| 27 | Conway | 22,001 | 16,424 | 34.0% | |||||
| 28 | St. Andrews | 21,383 | 20,835 | 2.6% | |||||
| 29 | Wade Hampton | 20,879 | 20,311 | 2.8% | |||||
| 30 | Hanahan | 20,381 | 16,944 | 20.3% | |||||
| 31 | Five Forks | 19,158 | 13,137 | 45.8% | |||||
| 32 | North Myrtle Beach | 18,502 | 13,397 | 38.1% | |||||
| 33 | West Columbia | 17,265 | 14,668 | 17.7% | |||||
| 34 | Clemson | 17,238 | 13,596 | 26.8% | |||||
| 35 | Red Hill | 16,060 | 13,846 | 16.0% | |||||
| 36 | Berea | 15,892 | 12,932 | 22.9% | |||||
| 37 | Seven Oaks | 15,561 | 16,332 | -4.7% | |||||
| 38 | Dentsville | 15,245 | 13,475 | 13.1% | |||||
| 39 | Gantt | 14,790 | 13,874 | 6.6% | |||||
| 40 | Ladson | 14,711 | 14,166 | 3.8% | |||||
| 41 | Cayce | 13,637 | 12,319 | 10.7% | |||||
| 42 | Lake Wylie | 13,560 | 8,362 | 62.2% | |||||
| 43 | Parker | 13,019 | 10,286 | 26.6% | |||||
| 44 | Beaufort | 12,899 | 12,492 | 3.3% | |||||
| 45 | Orangeburg | 12,779 | 13,855 | -7.8% | |||||
| 46 | Port Royal | 12,734 | 10,442 | 21.9% | |||||
| 47 | Moncks Corner | 12,685 | 7,508 | 69.0% | |||||
| 48 | Gaffney | 12,560 | 12,492 | 0.5% | |||||
| 49 | Tega Cay | 12,336 | 7,014 | 75.9% | |||||
| 50 | Oak Grove | 11,803 | 10,479 | 12.6% | |||||
| 51 | James Island | 11,618 | 0 | nan% | |||||
| 52 | Irmo | 11,581 | 11,085 | 4.5% | |||||
| 53 | Forest Acres | 10,621 | 10,412 | 2.0% | |||||
| 54 | Garden City | 10,600 | 8,864 | 19.6% | |||||
| 55 | Boiling Springs | 10,591 | 8,248 | 28.4% | |||||
| 56 | Newberry | 10,496 | 10,272 | 2.2% | |||||
| 57 | Fountain Inn | 10,237 | 7,411 | 38.1% | |||||
| 58 | Red Bank | 10,070 | 10,084 | -0.1% | |||||
| 59 | Little River | 9,929 | 8,675 | 14.5% | |||||
| 60 | Powdersville | 9,880 | 7,998 | 23.5% | |||||
| 61 | Murrells Inlet | 9,695 | 7,331 | 32.2% | |||||
| 62 | Sangaree | 9,336 | 9,018 | 3.5% | |||||
| 63 | Laurens | 9,251 | 9,265 | -0.2% | |||||
| 64 | Lugoff | 9,127 | 7,074 | 29.0% | |||||
| 65 | Woodfield | 8,970 | 10,054 | -10.8% | |||||
| 66 | Seneca | 8,734 | 8,024 | 8.8% | |||||
| 67 | Lancaster | 8,489 | 8,283 | 2.5% | |||||
| 68 | Georgetown | 8,435 | 9,302 | -9.3% | |||||
| 69 | York | 8,423 | 7,613 | 10.6% | |||||
| 70 | Sans Souci | 8,421 | 8,230 | 2.3% | |||||
| 71 | Union | 8,119 | 8,485 | -4.3% | |||||
| 72 | Burton | 7,818 | 7,144 | 9.4% | |||||
| 73 | Clinton | 7,753 | 8,615 | -10.0% | |||||
| 74 | Travelers Rest | 7,670 | 4,466 | 71.7% | |||||
| 75 | Camden | 7,666 | 6,805 | 12.7% | |||||
| 76 | Valley Falls | 7,583 | 5,526 | 37.2% | |||||
| 77 | Hartsville | 7,565 | 7,806 | -3.1% | |||||
| 78 | Welcome | 7,462 | 6,907 | 8.0% | |||||
| 79 | Bennettsville | 7,306 | 9,322 | -21.6% | |||||
| 80 | Centerville | 7,276 | 6,446 | 12.9% | |||||
| 81 | Forestbrook | 7,256 | 4,231 | 71.5% | |||||
| 82 | Hardeeville | 7,228 | 2,985 | 142.1% | |||||
| 83 | Homeland Park | 6,790 | 6,062 | 12.0% | |||||
| 84 | Lake Murray Of Richland | 6,632 | 4,853 | 36.7% | |||||
| 85 | Clover | 6,566 | 4,916 | 33.6% | |||||
| 86 | Marion | 6,472 | 6,970 | -7.1% | |||||
| 87 | Dillon | 6,354 | 6,740 | -5.7% | |||||
| 88 | Darlington | 6,153 | 6,374 | -3.5% | |||||
| 89 | Lake City | 6,028 | 6,690 | -9.9% | |||||
| 90 | Laurel Bay | 5,926 | 5,594 | 5.9% | |||||
| 91 | Lyman | 5,841 | 3,111 | 87.8% | |||||
| 92 | Piedmont | 5,581 | 5,062 | 10.3% | |||||
| 93 | Walterboro | 5,514 | 5,412 | 1.9% | |||||
| 94 | Belvedere | 5,330 | 5,428 | -1.8% | |||||
| 95 | Batesburg-Leesville | 5,322 | 5,288 | 0.6% | |||||
| 96 | Hollywood | 5,319 | 4,597 | 15.7% | |||||
| 97 | Chester | 5,283 | 5,752 | -8.2% | |||||
| 98 | Central | 5,229 | 4,866 | 7.5% | |||||
| 99 | Cheraw | 5,090 | 5,828 | -12.7% | |||||
| 100 | Abbeville | 4,902 | 5,378 | -8.9% | |||||
| 101 | Blythewood | 4,543 | 1,459 | 211.4% | |||||
| 102 | Barnwell | 4,526 | 4,791 | -5.5% | |||||
| 103 | Newport | 4,441 | 3,918 | 13.3% | |||||
| 104 | Edgefield | 4,434 | 4,749 | -6.6% | |||||
| 105 | Belton | 4,320 | 4,189 | 3.1% | |||||
| 106 | Isle Of Palms | 4,318 | 4,202 | 2.8% | |||||
| 107 | Southern Shops | 4,264 | 4,576 | -6.8% | |||||
| 108 | Brookdale | 4,221 | 4,329 | -2.5% | |||||
| 109 | Woodruff | 4,178 | 4,097 | 2.0% | |||||
| 110 | Surfside Beach | 4,155 | 3,963 | 4.8% | |||||
| 111 | India Hook | 4,092 | 3,417 | 19.8% | |||||
| 112 | Walhalla | 4,076 | 4,196 | -2.9% | |||||
| 113 | Mullins | 4,068 | 4,735 | -14.1% | |||||
| 114 | Williamston | 4,047 | 3,893 | 4.0% | |||||
| 115 | Saxon | 4,007 | 4,227 | -5.2% | |||||
| 116 | Clearwater | 3,985 | 4,238 | -6.0% | |||||
| 117 | Duncan | 3,937 | 3,099 | 27.0% | |||||
| 118 | Manning | 3,919 | 4,185 | -6.4% | |||||
| 119 | Northlake | 3,840 | 3,600 | 6.7% | |||||
| 120 | Ridgeland | 3,664 | 4,132 | -11.3% | |||||
| 121 | Honea Path | 3,659 | 3,777 | -3.1% | |||||
| 122 | Lesslie | 3,534 | 3,050 | 15.9% | |||||
| 123 | Roebuck | 3,482 | 1,633 | 113.2% | |||||
| 124 | Pendleton | 3,447 | 2,961 | 16.4% | |||||
| 125 | Arcadia | 3,397 | 1,512 | 124.7% | |||||
| 126 | Liberty | 3,349 | 3,238 | 3.4% | |||||
| 127 | Pickens | 3,326 | 3,134 | 6.1% | |||||
| 128 | Dalzell | 3,319 | 3,226 | 2.9% | |||||
| 129 | Golden Grove | 3,317 | 3,047 | 8.9% | |||||
| 130 | Dunean | 3,292 | 3,609 | -8.8% | |||||
| 131 | Kingstree | 3,244 | 3,426 | -5.3% | |||||
| 132 | Winnsboro | 3,234 | 3,657 | -11.6% | |||||
| 133 | Wellford | 3,217 | 1,830 | 75.8% | |||||
| 134 | Denmark | 3,186 | 3,589 | -11.2% | |||||
| 135 | Saluda | 3,179 | 3,450 | -7.9% | |||||
| 136 | Bamberg | 3,103 | 3,633 | -14.6% | |||||
| 137 | Gloverville | 3,102 | 3,271 | -5.2% | |||||
| 138 | Burne | 3,058 | 2,671 | 14.5% | |||||
| 139 | Bishopville | 3,042 | 3,555 | -14.4% | |||||
| 140 | Mccormick | 2,936 | 2,555 | 14.9% | |||||
| 141 | Cherryvale | 2,912 | 3,050 | -4.5% | |||||
| 142 | Williston | 2,909 | 3,165 | -8.1% | |||||
| 143 | Hampton | 2,907 | 2,838 | 2.4% | |||||
| 144 | Inman | 2,896 | 2,186 | 32.5% | |||||
| 145 | Elgin | 2,876 | 2,314 | 24.3% | |||||
| 146 | Lakewood | 2,862 | 2,716 | 5.4% | |||||
| 147 | Pageland | 2,854 | 2,737 | 4.3% | |||||
| 148 | Allendale | 2,827 | 3,626 | -22.0% | |||||
| 149 | East Gaffney | 2,773 | 2,784 | -0.4% | |||||
| 150 | Springdale | 2,731 | 2,623 | 4.1% | |||||
| 151 | Pine Ridge | 2,723 | 2,203 | 23.6% | |||||
| 152 | Andrews | 2,721 | 2,958 | -8.0% | |||||
| 153 | North Hartsville | 2,646 | 3,266 | -19.0% | |||||
| 154 | Graniteville | 2,625 | 2,845 | -7.7% | |||||
| 155 | South Congaree | 2,613 | 2,367 | 10.4% | |||||
| 156 | Ravenel | 2,543 | 2,196 | 15.8% | |||||
| 157 | Shell Point | 2,479 | 3,075 | -19.4% | |||||
| 158 | Loris | 2,473 | 2,424 | 2.0% | |||||
| 159 | Landrum | 2,465 | 2,275 | 8.4% | |||||
| 160 | Estill | 2,426 | 2,427 | 0.0% | |||||
| 161 | New Ellenton | 2,423 | 2,173 | 11.5% | |||||
| 162 | Blacksburg | 2,390 | 2,007 | 19.1% | |||||
| 163 | Ninety Six | 2,389 | 1,831 | 30.5% | |||||
| 164 | Westminster | 2,385 | 2,370 | 0.6% | |||||
| 165 | Kershaw | 2,249 | 1,835 | 22.6% | |||||
| 166 | Johnston | 2,248 | 2,471 | -9.0% | |||||
| 167 | Sullivan's Island | 2,220 | 2,048 | 8.4% | |||||
| 168 | St. George | 2,185 | 1,994 | 9.6% | |||||
| 169 | Timmonsville | 2,158 | 2,624 | -17.8% | |||||
| 170 | Watts Mills | 2,157 | 1,743 | 23.8% | |||||
| 171 | Pacolet | 2,154 | 1,991 | 8.2% | |||||
| 172 | Fairfax | 2,142 | 3,519 | -39.1% | |||||
| 173 | Blackville | 2,135 | 3,287 | -35.0% | |||||
| 174 | Gaston | 2,089 | 1,233 | 69.4% | |||||
| 175 | Winnsboro Mills | 2,048 | 1,998 | 2.5% | |||||
| 176 | St. Matthews | 2,038 | 2,053 | -0.7% | |||||
| 177 | Eureka Mill | 2,036 | 2,306 | -11.7% | |||||
| 178 | Tigerville | 2,025 | 919 | 120.3% | |||||
| 179 | Jackson | 2,024 | 1,612 | 25.6% | |||||
| 180 | Ware Shoals | 2,022 | 2,650 | -23.7% | |||||
| 181 | Wilkinson Heights | 1,995 | 2,274 | -12.3% | |||||
| 182 | Wedgefield | 1,994 | 1,389 | 43.6% | |||||
| 183 | Edisto | 1,991 | 2,361 | -15.7% | |||||
| 184 | Cowpens | 1,990 | 1,713 | 16.2% | |||||
| 185 | Riverview | 1,989 | 386 | 415.3% | |||||
| 186 | Langley | 1,975 | 1,440 | 37.2% | |||||
| 187 | Arial | 1,969 | 2,617 | -24.8% | |||||
| 188 | Kiawah Island | 1,964 | 1,638 | 19.9% | |||||
| 189 | Privateer | 1,964 | 2,052 | -4.3% | |||||
| 190 | Varnville | 1,954 | 1,839 | 6.3% | |||||
| 191 | Mccoll | 1,950 | 2,612 | -25.3% | |||||
| 192 | Seabrook Island | 1,904 | 1,816 | 4.8% | |||||
| 193 | Calhoun Falls | 1,878 | 2,207 | -14.9% | |||||
| 194 | Slater-Marietta | 1,874 | 2,291 | -18.2% | |||||
| 195 | Great Falls | 1,860 | 2,175 | -14.5% | |||||
| 196 | Hopkins | 1,757 | 3,061 | -42.6% | |||||
| 197 | South Sumter | 1,755 | 2,414 | -27.3% | |||||
| 198 | Stateburg | 1,739 | 1,486 | 17.0% | |||||
| 199 | Utica | 1,729 | 1,639 | 5.5% | |||||
| 200 | Mayo | 1,719 | 1,506 | 14.1% | |||||
| 201 | Latta | 1,632 | 1,649 | -1.0% | |||||
| 202 | Ridgeville | 1,592 | 1,740 | -8.5% | |||||
| 203 | Awendaw | 1,585 | 1,247 | 27.1% | |||||
| 204 | Reidville | 1,569 | 546 | 187.4% | |||||
| 205 | Fairforest | 1,565 | 1,885 | -17.0% | |||||
| 206 | Chapin | 1,544 | 1,248 | 23.7% | |||||
| 207 | Monarch Mill | 1,528 | 2,150 | -28.9% | |||||
| 208 | Judson | 1,513 | 2,065 | -26.7% | |||||
| 209 | Whitmire | 1,503 | 1,567 | -4.1% | |||||
| 210 | Catawba | 1,501 | 1,719 | -12.7% | |||||
| 211 | Joanna | 1,470 | 1,442 | 1.9% | |||||
| 212 | St. Stephen | 1,454 | 2,101 | -30.8% | |||||
| 213 | City View | 1,426 | 1,426 | 0.0% | |||||
| 214 | Chesterfield | 1,404 | 1,513 | -7.2% | |||||
| 215 | Wagener | 1,357 | 483 | 181.0% | |||||
| 216 | Cane Savannah | 1,353 | 1,400 | -3.4% | |||||
| 217 | Holly Hill | 1,346 | 1,103 | 22.0% | |||||
| 218 | Pelzer | 1,335 | 87 | 1434.5% | |||||
| 219 | Buffalo | 1,330 | 1,322 | 0.6% | |||||
| 220 | Murphys Estates | 1,297 | 2,256 | -42.5% | |||||
| 221 | Irwin | 1,276 | 1,937 | -34.1% | |||||
| 222 | Iva | 1,253 | 1,129 | 11.0% | |||||
| 223 | Prosperity | 1,203 | 971 | 23.9% | |||||
| 224 | Six Mile | 1,185 | 760 | 55.9% | |||||
| 225 | Johnsonville | 1,170 | 1,422 | -17.7% | |||||
| 226 | Meggett | 1,169 | 1,109 | 5.4% | |||||
| 227 | Branchville | 1,158 | 980 | 18.2% | |||||
| 228 | Cottageville | 1,155 | 996 | 16.0% | |||||
| 229 | West Pelzer | 1,136 | 705 | 61.1% | |||||
| 230 | Lake Secession | 1,121 | 954 | 17.5% | |||||
| 231 | Pelion | 1,090 | 766 | 42.3% | |||||
| 232 | Due West | 1,078 | 1,484 | -27.4% | |||||
| 233 | Lamar | 1,074 | 767 | 40.0% | |||||
| 234 | Pamplico | 1,072 | 1,117 | -4.0% | |||||
| 235 | Bonneau Beach | 1,045 | 1,811 | -42.3% | |||||
| 236 | Oakland | 1,038 | 1,361 | -23.7% | |||||
| 237 | Folly Beach | 1,035 | 2,523 | -59.0% | |||||
| 238 | Santee | 1,029 | 909 | 13.2% | |||||