Brighton, CO
Demographics And Statistics
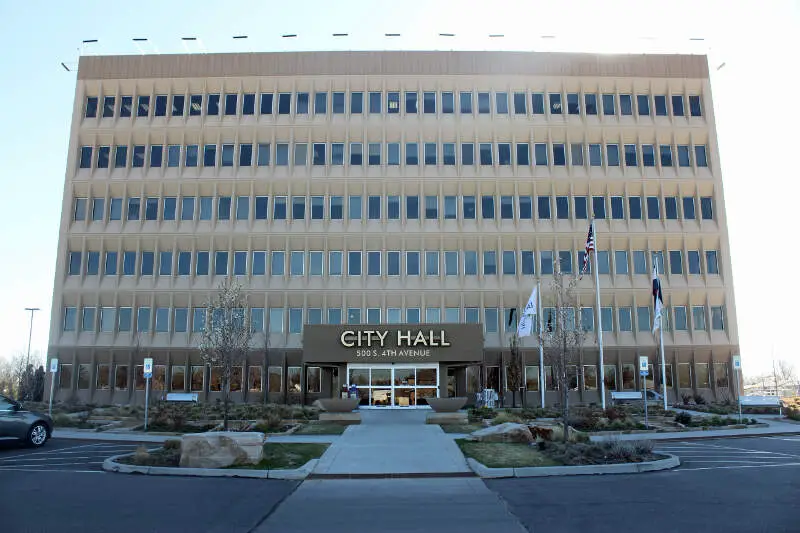
Living In Brighton, Colorado Summary
Life in Brighton research summary. HomeSnacks has been using Saturday Night Science to research the quality of life in Brighton over the past nine years using Census, FBI, Zillow, and other primary data sources. Based on the most recently available data, we found the following about life in Brighton:
The population in Brighton is 40,569.
The median home value in Brighton is $497,256.
The median income in Brighton is $86,975.
The cost of living in Brighton is 99 which is 1.0x lower than the national average.
The median rent in Brighton is $1,629.
The unemployment rate in Brighton is 5.1%.
The poverty rate in Brighton is 9.1%.
The average high in Brighton is 64.9° and the average low is 36.0°.
Brighton SnackAbility
Overall SnackAbility
Brighton, CO Crime Report
Crime in Brighton summary. We use data from the FBI to determine the crime rates in Brighton. Key points include:
There were 1,379 total crimes in Brighton in the last reporting year.
The overall crime rate per 100,000 people in Brighton is 3,346.7 / 100k people.
The violent crime rate per 100,000 people in Brighton is 412.6 / 100k people.
The property crime rate per 100,000 people in Brighton is 2,934.1 / 100k people.
Overall, crime in Brighton is 43.99% above the national average.
Total Crimes
Above National Average
Crime In Brighton Comparison Table
| Statistic | Count Raw |
Brighton / 100k People |
Colorado / 100k People |
National / 100k People |
|---|---|---|---|---|
| Total Crimes Per 100K | 1,379 | 3,346.7 | 3,256.9 | 2,324.2 |
| Violent Crime | 170 | 412.6 | 423.1 | 369.8 |
| Murder | 3 | 7.3 | 5.1 | 6.3 |
| Robbery | 5 | 12.1 | 68.3 | 66.1 |
| Aggravated Assault | 124 | 300.9 | 286.9 | 268.2 |
| Property Crime | 1,209 | 2,934.1 | 2,833.8 | 1,954.4 |
| Burglary | 95 | 230.6 | 400.3 | 269.8 |
| Larceny | 833 | 2,021.6 | 1,909.3 | 1,401.9 |
| Car Theft | 281 | 682.0 | 524.3 | 282.7 |
Brighton, CO Cost Of Living
Cost of living in Brighton summary. We use data on the cost of living to determine how expensive it is to live in Brighton. Real estate prices drive most of the variance in cost of living around Colorado. Key points include:
The cost of living in Brighton is 99 with 100 being average.
The cost of living in Brighton is 1.0x lower than the national average.
The median home value in Brighton is $497,256.
The median income in Brighton is $86,975.
Brighton's Overall Cost Of Living
Lower Than The National Average
Cost Of Living In Brighton Comparison Table
| Living Expense | Brighton | Colorado | National Average | |
|---|---|---|---|---|
| Overall | 99 | 104 | 100 | |
| Services | 99 | 102 | 100 | |
| Groceries | 87 | 99 | 100 | |
| Health | 86 | 100 | 100 | |
| Housing | 116 | 116 | 100 | |
| Transportation | 111 | 104 | 100 | |
| Utilities | 77 | 90 | 100 | |
Brighton, CO Weather
The average high in Brighton is 64.9° and the average low is 36.0°.
There are 36.6 days of precipitation each year.
Expect an average of 15.8 inches of precipitation each year with 46.9 inches of snow.
| Stat | Brighton |
|---|---|
| Average Annual High | 64.9 |
| Average Annual Low | 36.0 |
| Annual Precipitation Days | 36.6 |
| Average Annual Precipitation | 15.8 |
| Average Annual Snowfall | 46.9 |
Average High
Days of Rain
Brighton, CO Photos
Rankings for Brighton in Colorado


Locations Around Brighton
Map Of Brighton, CO
Best Places Around Brighton
Federal Heights, CO
Population 14,173
Aurora, CO
Population 387,349
Fort Lupton, CO
Population 8,164
Commerce, GA
Population 7,391
Berkley, CO
Population 11,185
Welby, CO
Population 16,287
Sherrelwood, CO
Population 19,254
Denver, CO
Population 710,800
Firestone, CO
Population 16,704
Northglenn, CO
Population 37,948
Brighton Demographics And Statistics
Population over time in Brighton
The current population in Brighton is 40,569. The population has increased 30.1% from 2010.
| Year | Population | % Change |
|---|---|---|
| 2022 | 40,569 | 3.9% |
| 2021 | 39,054 | 2.7% |
| 2020 | 38,016 | 4.7% |
| 2019 | 36,307 | 2.0% |
| 2018 | 35,582 | 1.7% |
| 2017 | 35,004 | 2.2% |
| 2016 | 34,247 | 3.1% |
| 2015 | 33,219 | 2.6% |
| 2014 | 32,377 | 3.8% |
| 2013 | 31,181 | - |
Race / Ethnicity in Brighton
Brighton is:
52.7% White with 21,372 White residents.
3.1% African American with 1,257 African American residents.
0.2% American Indian with 97 American Indian residents.
1.7% Asian with 688 Asian residents.
0.1% Hawaiian with 50 Hawaiian residents.
0.1% Other with 59 Other residents.
3.4% Two Or More with 1,372 Two Or More residents.
38.6% Hispanic with 15,674 Hispanic residents.
| Race | Brighton | CO | USA |
|---|---|---|---|
| White | 52.7% | 66.2% | 58.9% |
| African American | 3.1% | 3.8% | 12.1% |
| American Indian | 0.2% | 0.4% | 0.6% |
| Asian | 1.7% | 3.1% | 5.7% |
| Hawaiian | 0.1% | 0.1% | 0.2% |
| Other | 0.1% | 0.4% | 0.4% |
| Two Or More | 3.4% | 3.8% | 3.5% |
| Hispanic | 38.6% | 22.1% | 18.7% |
Gender in Brighton
Brighton is 48.6% female with 19,714 female residents.
Brighton is 51.4% male with 20,855 male residents.
| Gender | Brighton | CO | USA |
|---|---|---|---|
| Female | 48.6% | 49.3% | 50.4% |
| Male | 51.4% | 50.7% | 49.6% |
Highest level of educational attainment in Brighton for adults over 25
5.0% of adults in Brighton completed < 9th grade.
10.0% of adults in Brighton completed 9-12th grade.
32.0% of adults in Brighton completed high school / ged.
22.0% of adults in Brighton completed some college.
9.0% of adults in Brighton completed associate's degree.
15.0% of adults in Brighton completed bachelor's degree.
6.0% of adults in Brighton completed master's degree.
0.0% of adults in Brighton completed professional degree.
1.0% of adults in Brighton completed doctorate degree.
| Education | Brighton | CO | USA |
|---|---|---|---|
| < 9th Grade | 5.0% | 4.0% | 4.0% |
| 9-12th Grade | 10.0% | 4.0% | 6.0% |
| High School / GED | 32.0% | 20.0% | 26.0% |
| Some College | 22.0% | 20.0% | 20.0% |
| Associate's Degree | 9.0% | 8.0% | 9.0% |
| Bachelor's Degree | 15.0% | 27.0% | 21.0% |
| Master's Degree | 6.0% | 12.0% | 10.0% |
| Professional Degree | 0.0% | 3.0% | 2.0% |
| Doctorate Degree | 1.0% | 2.0% | 2.0% |
Household Income For Brighton, Colorado
2.7% of households in Brighton earn Less than $10,000.
2.7% of households in Brighton earn $10,000 to $14,999.
4.4% of households in Brighton earn $15,000 to $24,999.
5.0% of households in Brighton earn $25,000 to $34,999.
9.8% of households in Brighton earn $35,000 to $49,999.
18.6% of households in Brighton earn $50,000 to $74,999.
13.6% of households in Brighton earn $75,000 to $99,999.
20.7% of households in Brighton earn $100,000 to $149,999.
13.9% of households in Brighton earn $150,000 to $199,999.
8.6% of households in Brighton earn $200,000 or more.
| Income | Brighton | CO | USA |
|---|---|---|---|
| Less than $10,000 | 2.7% | 3.9% | 4.9% |
| $10,000 to $14,999 | 2.7% | 2.7% | 3.8% |
| $15,000 to $24,999 | 4.4% | 5.4% | 7.0% |
| $25,000 to $34,999 | 5.0% | 5.9% | 7.4% |
| $35,000 to $49,999 | 9.8% | 9.4% | 10.7% |
| $50,000 to $74,999 | 18.6% | 15.6% | 16.1% |
| $75,000 to $99,999 | 13.6% | 13.2% | 12.8% |
| $100,000 to $149,999 | 20.7% | 19.2% | 17.1% |
| $150,000 to $199,999 | 13.9% | 10.8% | 8.8% |
| $200,000 or more | 8.6% | 13.9% | 11.4% |


