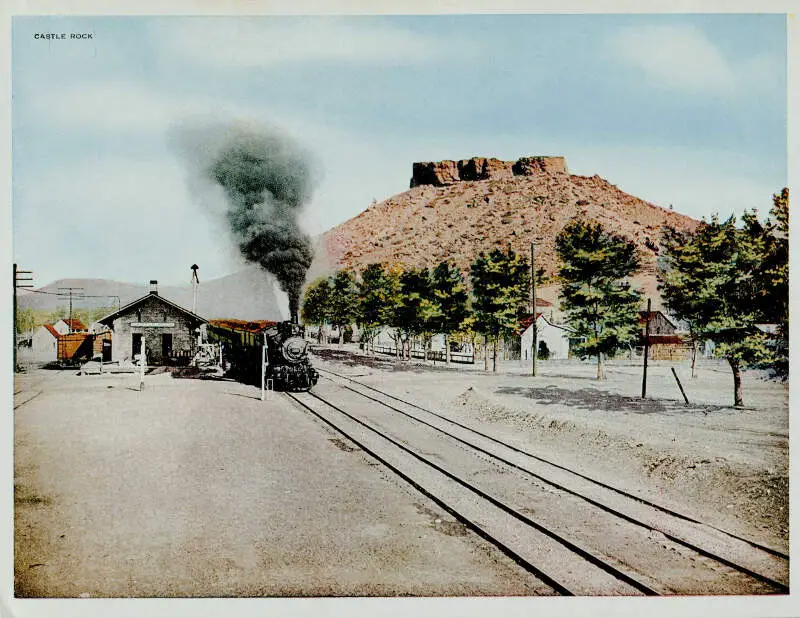
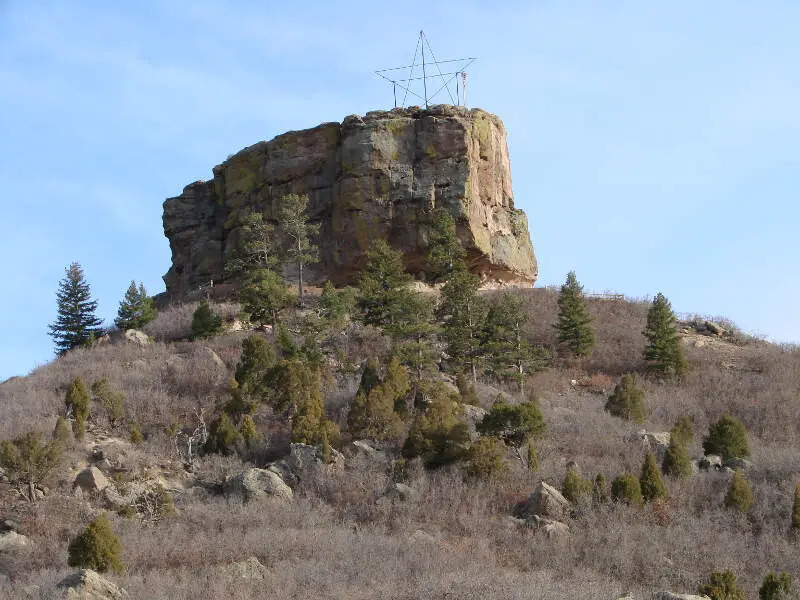
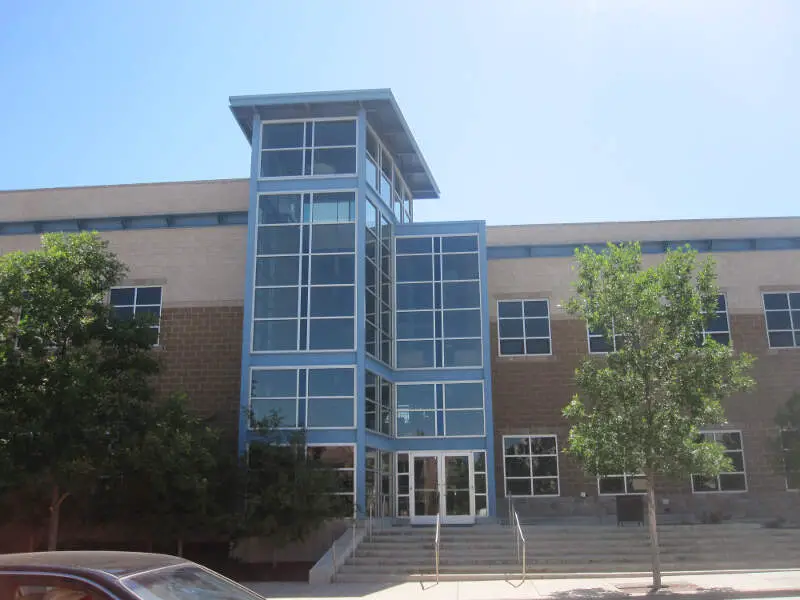
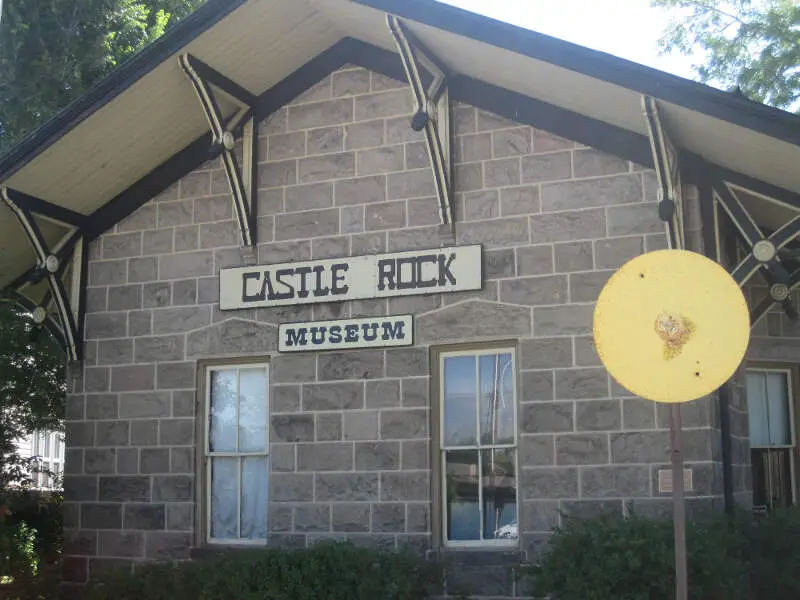
Castle Rock, CO
Demographics And Statistics
Living In Castle Rock, Colorado Summary
Life in Castle Rock research summary. HomeSnacks has been using Saturday Night Science to research the quality of life in Castle Rock over the past nine years using Census, FBI, Zillow, and other primary data sources. Based on the most recently available data, we found the following about life in Castle Rock:
The population in Castle Rock is 74,065.
The median home value in Castle Rock is $655,932.
The median income in Castle Rock is $135,985.
The cost of living in Castle Rock is 122 which is 1.2x higher than the national average.
The median rent in Castle Rock is $1,810.
The unemployment rate in Castle Rock is 4.2%.
The poverty rate in Castle Rock is 3.5%.
The average high in Castle Rock is 63.2° and the average low is 34.3°.
Castle Rock SnackAbility
Overall SnackAbility
Castle Rock, CO Crime Report
Crime in Castle Rock summary. We use data from the FBI to determine the crime rates in Castle Rock. Key points include:
There were 945 total crimes in Castle Rock in the last reporting year.
The overall crime rate per 100,000 people in Castle Rock is 1,194.7 / 100k people.
The violent crime rate per 100,000 people in Castle Rock is 31.6 / 100k people.
The property crime rate per 100,000 people in Castle Rock is 1,163.1 / 100k people.
Overall, crime in Castle Rock is -48.60% below the national average.
Total Crimes
Below National Average
Crime In Castle Rock Comparison Table
| Statistic | Count Raw |
Castle Rock / 100k People |
Colorado / 100k People |
National / 100k People |
|---|---|---|---|---|
| Total Crimes Per 100K | 945 | 1,194.7 | 3,256.9 | 2,324.2 |
| Violent Crime | 25 | 31.6 | 423.1 | 369.8 |
| Murder | 3 | 3.8 | 5.1 | 6.3 |
| Robbery | 3 | 3.8 | 68.3 | 66.1 |
| Aggravated Assault | 14 | 17.7 | 286.9 | 268.2 |
| Property Crime | 920 | 1,163.1 | 2,833.8 | 1,954.4 |
| Burglary | 63 | 79.6 | 400.3 | 269.8 |
| Larceny | 795 | 1,005.0 | 1,909.3 | 1,401.9 |
| Car Theft | 62 | 78.4 | 524.3 | 282.7 |
Castle Rock, CO Cost Of Living
Cost of living in Castle Rock summary. We use data on the cost of living to determine how expensive it is to live in Castle Rock. Real estate prices drive most of the variance in cost of living around Colorado. Key points include:
The cost of living in Castle Rock is 122 with 100 being average.
The cost of living in Castle Rock is 1.2x higher than the national average.
The median home value in Castle Rock is $655,932.
The median income in Castle Rock is $135,985.
Castle Rock's Overall Cost Of Living
Higher Than The National Average
Cost Of Living In Castle Rock Comparison Table
| Living Expense | Castle Rock | Colorado | National Average | |
|---|---|---|---|---|
| Overall | 122 | 104 | 100 | |
| Services | 106 | 102 | 100 | |
| Groceries | 96 | 99 | 100 | |
| Health | 100 | 100 | 100 | |
| Housing | 167 | 116 | 100 | |
| Transportation | 101 | 104 | 100 | |
| Utilities | 86 | 90 | 100 | |
Castle Rock, CO Weather
The average high in Castle Rock is 63.2° and the average low is 34.3°.
There are 45.1 days of precipitation each year.
Expect an average of 19.4 inches of precipitation each year with 73.6 inches of snow.
| Stat | Castle Rock |
|---|---|
| Average Annual High | 63.2 |
| Average Annual Low | 34.3 |
| Annual Precipitation Days | 45.1 |
| Average Annual Precipitation | 19.4 |
| Average Annual Snowfall | 73.6 |
Average High
Days of Rain
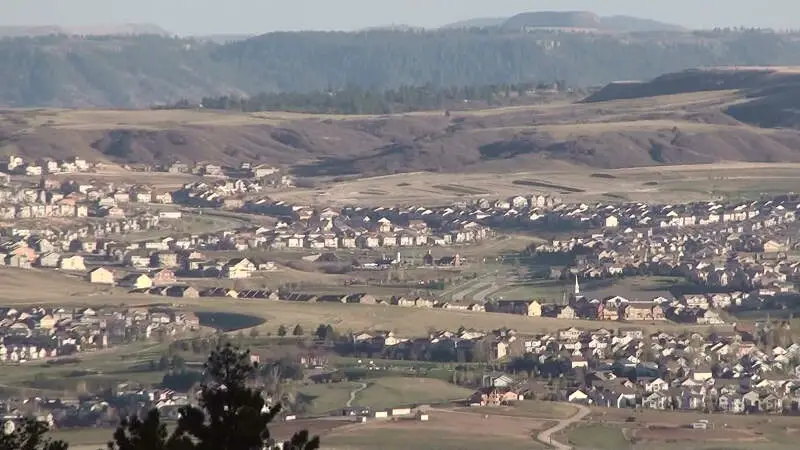
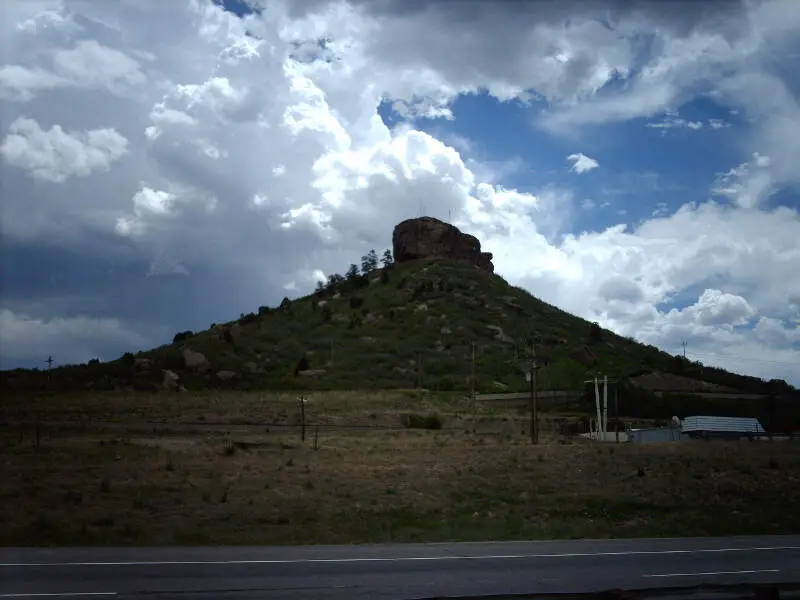
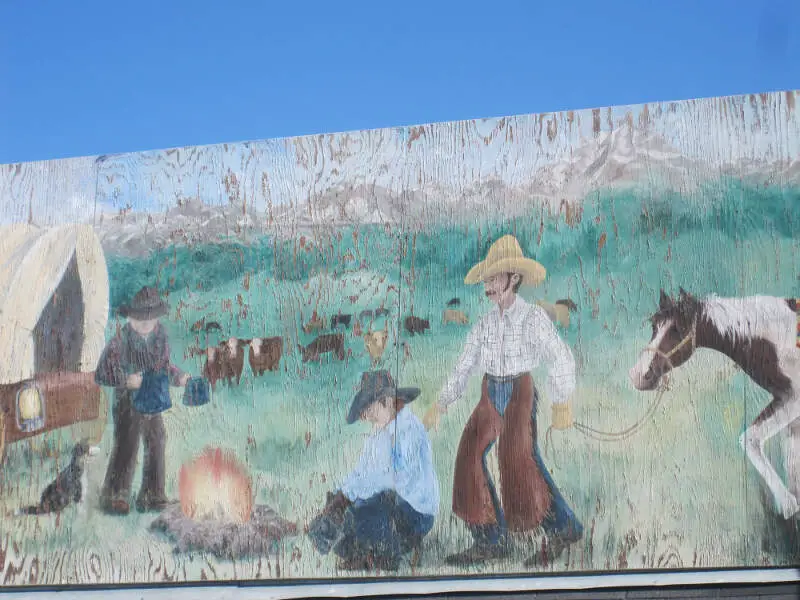
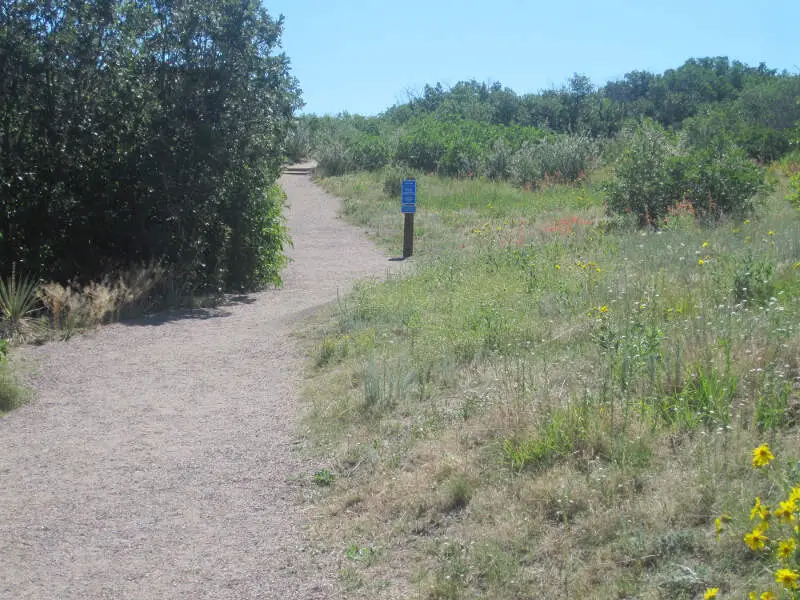
Castle Rock, CO Photos

Rankings for Castle Rock in Colorado


Locations Around Castle Rock
Map Of Castle Rock, CO
Best Places Around Castle Rock
Dove Valley, CO
Population 5,569
Lone Tree, CO
Population 13,993
Woodmoor, CO
Population 8,859
Littleton, CO
Population 45,531
Roxborough Park, CO
Population 9,057
Parker, CO
Population 58,733
The Pinery, CO
Population 10,534
Cherry Creek, CO
Population 11,157
Centennial, CO
Population 107,702
Castle Rock Demographics And Statistics
Population over time in Castle Rock
The current population in Castle Rock is 74,065. The population has increased 66.8% from 2010.
| Year | Population | % Change |
|---|---|---|
| 2022 | 74,065 | 24.1% |
| 2021 | 59,680 | 4.2% |
| 2020 | 57,274 | 6.5% |
| 2019 | 53,789 | 3.2% |
| 2018 | 52,143 | 0.7% |
| 2017 | 51,802 | 3.6% |
| 2016 | 49,990 | 3.5% |
| 2015 | 48,321 | 4.1% |
| 2014 | 46,420 | 4.5% |
| 2013 | 44,402 | - |
Race / Ethnicity in Castle Rock
Castle Rock is:
81.3% White with 60,244 White residents.
0.7% African American with 530 African American residents.
0.2% American Indian with 162 American Indian residents.
2.2% Asian with 1,594 Asian residents.
0.1% Hawaiian with 62 Hawaiian residents.
0.5% Other with 367 Other residents.
4.3% Two Or More with 3,196 Two Or More residents.
10.7% Hispanic with 7,910 Hispanic residents.
| Race | Castle Rock | CO | USA |
|---|---|---|---|
| White | 81.3% | 66.2% | 58.9% |
| African American | 0.7% | 3.8% | 12.1% |
| American Indian | 0.2% | 0.4% | 0.6% |
| Asian | 2.2% | 3.1% | 5.7% |
| Hawaiian | 0.1% | 0.1% | 0.2% |
| Other | 0.5% | 0.4% | 0.4% |
| Two Or More | 4.3% | 3.8% | 3.5% |
| Hispanic | 10.7% | 22.1% | 18.7% |
Gender in Castle Rock
Castle Rock is 50.3% female with 37,279 female residents.
Castle Rock is 49.7% male with 36,786 male residents.
| Gender | Castle Rock | CO | USA |
|---|---|---|---|
| Female | 50.3% | 49.3% | 50.4% |
| Male | 49.7% | 50.7% | 49.6% |
Highest level of educational attainment in Castle Rock for adults over 25
1.0% of adults in Castle Rock completed < 9th grade.
2.0% of adults in Castle Rock completed 9-12th grade.
14.0% of adults in Castle Rock completed high school / ged.
21.0% of adults in Castle Rock completed some college.
9.0% of adults in Castle Rock completed associate's degree.
37.0% of adults in Castle Rock completed bachelor's degree.
13.0% of adults in Castle Rock completed master's degree.
2.0% of adults in Castle Rock completed professional degree.
1.0% of adults in Castle Rock completed doctorate degree.
| Education | Castle Rock | CO | USA |
|---|---|---|---|
| < 9th Grade | 1.0% | 4.0% | 4.0% |
| 9-12th Grade | 2.0% | 4.0% | 6.0% |
| High School / GED | 14.0% | 20.0% | 26.0% |
| Some College | 21.0% | 20.0% | 20.0% |
| Associate's Degree | 9.0% | 8.0% | 9.0% |
| Bachelor's Degree | 37.0% | 27.0% | 21.0% |
| Master's Degree | 13.0% | 12.0% | 10.0% |
| Professional Degree | 2.0% | 3.0% | 2.0% |
| Doctorate Degree | 1.0% | 2.0% | 2.0% |
Household Income For Castle Rock, Colorado
2.2% of households in Castle Rock earn Less than $10,000.
0.9% of households in Castle Rock earn $10,000 to $14,999.
2.1% of households in Castle Rock earn $15,000 to $24,999.
3.5% of households in Castle Rock earn $25,000 to $34,999.
6.7% of households in Castle Rock earn $35,000 to $49,999.
9.5% of households in Castle Rock earn $50,000 to $74,999.
10.7% of households in Castle Rock earn $75,000 to $99,999.
22.9% of households in Castle Rock earn $100,000 to $149,999.
16.9% of households in Castle Rock earn $150,000 to $199,999.
24.6% of households in Castle Rock earn $200,000 or more.
| Income | Castle Rock | CO | USA |
|---|---|---|---|
| Less than $10,000 | 2.2% | 3.9% | 4.9% |
| $10,000 to $14,999 | 0.9% | 2.7% | 3.8% |
| $15,000 to $24,999 | 2.1% | 5.4% | 7.0% |
| $25,000 to $34,999 | 3.5% | 5.9% | 7.4% |
| $35,000 to $49,999 | 6.7% | 9.4% | 10.7% |
| $50,000 to $74,999 | 9.5% | 15.6% | 16.1% |
| $75,000 to $99,999 | 10.7% | 13.2% | 12.8% |
| $100,000 to $149,999 | 22.9% | 19.2% | 17.1% |
| $150,000 to $199,999 | 16.9% | 10.8% | 8.8% |
| $200,000 or more | 24.6% | 13.9% | 11.4% |


