Littleton, CO
Demographics And Statistics
Living In Littleton, Colorado Summary
Life in Littleton research summary. HomeSnacks has been using Saturday Night Science to research the quality of life in Littleton over the past nine years using Census, FBI, Zillow, and other primary data sources. Based on the most recently available data, we found the following about life in Littleton:
The population in Littleton is 45,531.
The median home value in Littleton is $674,009.
The median income in Littleton is $90,273.
The cost of living in Littleton is 116 which is 1.2x higher than the national average.
The median rent in Littleton is $1,554.
The unemployment rate in Littleton is 3.9%.
The poverty rate in Littleton is 7.6%.
The average high in Littleton is 64.1° and the average low is 36.0°.
Littleton SnackAbility
Overall SnackAbility
Littleton, CO Crime Report
Crime in Littleton summary. We use data from the FBI to determine the crime rates in Littleton. Key points include:
There were 1,567 total crimes in Littleton in the last reporting year.
The overall crime rate per 100,000 people in Littleton is 3,496.1 / 100k people.
The violent crime rate per 100,000 people in Littleton is 245.4 / 100k people.
The property crime rate per 100,000 people in Littleton is 3,250.7 / 100k people.
Overall, crime in Littleton is 50.42% above the national average.
Total Crimes
Above National Average
Crime In Littleton Comparison Table
| Statistic | Count Raw |
Littleton / 100k People |
Colorado / 100k People |
National / 100k People |
|---|---|---|---|---|
| Total Crimes Per 100K | 1,567 | 3,496.1 | 3,256.9 | 2,324.2 |
| Violent Crime | 110 | 245.4 | 423.1 | 369.8 |
| Murder | 1 | 2.2 | 5.1 | 6.3 |
| Robbery | 22 | 49.1 | 68.3 | 66.1 |
| Aggravated Assault | 56 | 124.9 | 286.9 | 268.2 |
| Property Crime | 1,457 | 3,250.7 | 2,833.8 | 1,954.4 |
| Burglary | 269 | 600.2 | 400.3 | 269.8 |
| Larceny | 881 | 1,965.6 | 1,909.3 | 1,401.9 |
| Car Theft | 307 | 684.9 | 524.3 | 282.7 |
Littleton, CO Cost Of Living
Cost of living in Littleton summary. We use data on the cost of living to determine how expensive it is to live in Littleton. Real estate prices drive most of the variance in cost of living around Colorado. Key points include:
The cost of living in Littleton is 116 with 100 being average.
The cost of living in Littleton is 1.2x higher than the national average.
The median home value in Littleton is $674,009.
The median income in Littleton is $90,273.
Littleton's Overall Cost Of Living
Higher Than The National Average
Cost Of Living In Littleton Comparison Table
| Living Expense | Littleton | Colorado | National Average | |
|---|---|---|---|---|
| Overall | 116 | 104 | 100 | |
| Services | 106 | 102 | 100 | |
| Groceries | 92 | 99 | 100 | |
| Health | 97 | 100 | 100 | |
| Housing | 152 | 116 | 100 | |
| Transportation | 98 | 104 | 100 | |
| Utilities | 88 | 90 | 100 | |
Littleton, CO Weather
The average high in Littleton is 64.1° and the average low is 36.0°.
There are 41.3 days of precipitation each year.
Expect an average of 17.6 inches of precipitation each year with 57.3 inches of snow.
| Stat | Littleton |
|---|---|
| Average Annual High | 64.1 |
| Average Annual Low | 36.0 |
| Annual Precipitation Days | 41.3 |
| Average Annual Precipitation | 17.6 |
| Average Annual Snowfall | 57.3 |
Average High
Days of Rain
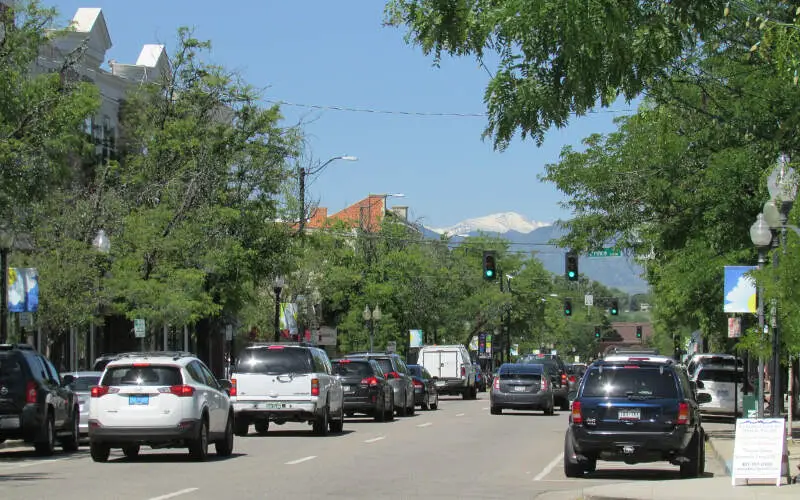
Littleton, CO Photos
3 Reviews & Comments About Littleton
/5

I make trash or I am the thrash lol -
I live in littleton. Great town with good education.and in Colorado.
HomeSnacks User - 2018-07-14 18:58:56.790095
There are amazing parks and open spaces. Crime is limited, and it feels very inclusive. There is dining ad=nd shopping mixed into the charming suburban city.
Downtown Littleton maintains many of its historic buildings including houses and a rail station. There is a free historical museum and plenty to do with the kids. Many historic homes have been turned into stores.
HomeSnacks User - 2018-09-06 00:46:44.555355
We love living in Littleton! The schools are great and our kids love growing up in a town with a "small town feel"
We love being an hour from the mountains, and having places like Red rocks within 15 minutes.
Rankings for Littleton in Colorado


Locations Around Littleton
Map Of Littleton, CO
Best Places Around Littleton
Sheridan, CO
Population 6,062
Federal Heights, CO
Population 14,173
Aurora, CO
Population 387,349
Dove Valley, CO
Population 5,569
Berkley, CO
Population 11,185
Englewood, CO
Population 33,634
Welby, CO
Population 16,287
Sherrelwood, CO
Population 19,254
Denver, CO
Population 710,800
Wheat Ridge, CO
Population 32,263
Littleton Demographics And Statistics
Population over time in Littleton
The current population in Littleton is 45,531. The population has increased 10.1% from 2010.
| Year | Population | % Change |
|---|---|---|
| 2022 | 45,531 | -3.2% |
| 2021 | 47,035 | 2.6% |
| 2020 | 45,848 | 1.7% |
| 2019 | 45,072 | 1.2% |
| 2018 | 44,553 | 1.9% |
| 2017 | 43,710 | 1.5% |
| 2016 | 43,065 | 1.5% |
| 2015 | 42,414 | 1.8% |
| 2014 | 41,683 | 0.8% |
| 2013 | 41,352 | - |
Race / Ethnicity in Littleton
Littleton is:
80.6% White with 36,686 White residents.
0.9% African American with 421 African American residents.
0.2% American Indian with 71 American Indian residents.
2.5% Asian with 1,142 Asian residents.
0.1% Hawaiian with 44 Hawaiian residents.
0.2% Other with 98 Other residents.
3.3% Two Or More with 1,492 Two Or More residents.
12.2% Hispanic with 5,577 Hispanic residents.
| Race | Littleton | CO | USA |
|---|---|---|---|
| White | 80.6% | 66.2% | 58.9% |
| African American | 0.9% | 3.8% | 12.1% |
| American Indian | 0.2% | 0.4% | 0.6% |
| Asian | 2.5% | 3.1% | 5.7% |
| Hawaiian | 0.1% | 0.1% | 0.2% |
| Other | 0.2% | 0.4% | 0.4% |
| Two Or More | 3.3% | 3.8% | 3.5% |
| Hispanic | 12.2% | 22.1% | 18.7% |
Gender in Littleton
Littleton is 50.8% female with 23,135 female residents.
Littleton is 49.2% male with 22,395 male residents.
| Gender | Littleton | CO | USA |
|---|---|---|---|
| Female | 50.8% | 49.3% | 50.4% |
| Male | 49.2% | 50.7% | 49.6% |
Highest level of educational attainment in Littleton for adults over 25
2.0% of adults in Littleton completed < 9th grade.
2.0% of adults in Littleton completed 9-12th grade.
16.0% of adults in Littleton completed high school / ged.
18.0% of adults in Littleton completed some college.
6.0% of adults in Littleton completed associate's degree.
35.0% of adults in Littleton completed bachelor's degree.
16.0% of adults in Littleton completed master's degree.
3.0% of adults in Littleton completed professional degree.
2.0% of adults in Littleton completed doctorate degree.
| Education | Littleton | CO | USA |
|---|---|---|---|
| < 9th Grade | 2.0% | 4.0% | 4.0% |
| 9-12th Grade | 2.0% | 4.0% | 6.0% |
| High School / GED | 16.0% | 20.0% | 26.0% |
| Some College | 18.0% | 20.0% | 20.0% |
| Associate's Degree | 6.0% | 8.0% | 9.0% |
| Bachelor's Degree | 35.0% | 27.0% | 21.0% |
| Master's Degree | 16.0% | 12.0% | 10.0% |
| Professional Degree | 3.0% | 3.0% | 2.0% |
| Doctorate Degree | 2.0% | 2.0% | 2.0% |
Household Income For Littleton, Colorado
4.2% of households in Littleton earn Less than $10,000.
3.2% of households in Littleton earn $10,000 to $14,999.
5.4% of households in Littleton earn $15,000 to $24,999.
6.1% of households in Littleton earn $25,000 to $34,999.
8.6% of households in Littleton earn $35,000 to $49,999.
14.9% of households in Littleton earn $50,000 to $74,999.
12.7% of households in Littleton earn $75,000 to $99,999.
19.6% of households in Littleton earn $100,000 to $149,999.
10.6% of households in Littleton earn $150,000 to $199,999.
14.6% of households in Littleton earn $200,000 or more.
| Income | Littleton | CO | USA |
|---|---|---|---|
| Less than $10,000 | 4.2% | 3.9% | 4.9% |
| $10,000 to $14,999 | 3.2% | 2.7% | 3.8% |
| $15,000 to $24,999 | 5.4% | 5.4% | 7.0% |
| $25,000 to $34,999 | 6.1% | 5.9% | 7.4% |
| $35,000 to $49,999 | 8.6% | 9.4% | 10.7% |
| $50,000 to $74,999 | 14.9% | 15.6% | 16.1% |
| $75,000 to $99,999 | 12.7% | 13.2% | 12.8% |
| $100,000 to $149,999 | 19.6% | 19.2% | 17.1% |
| $150,000 to $199,999 | 10.6% | 10.8% | 8.8% |
| $200,000 or more | 14.6% | 13.9% | 11.4% |


