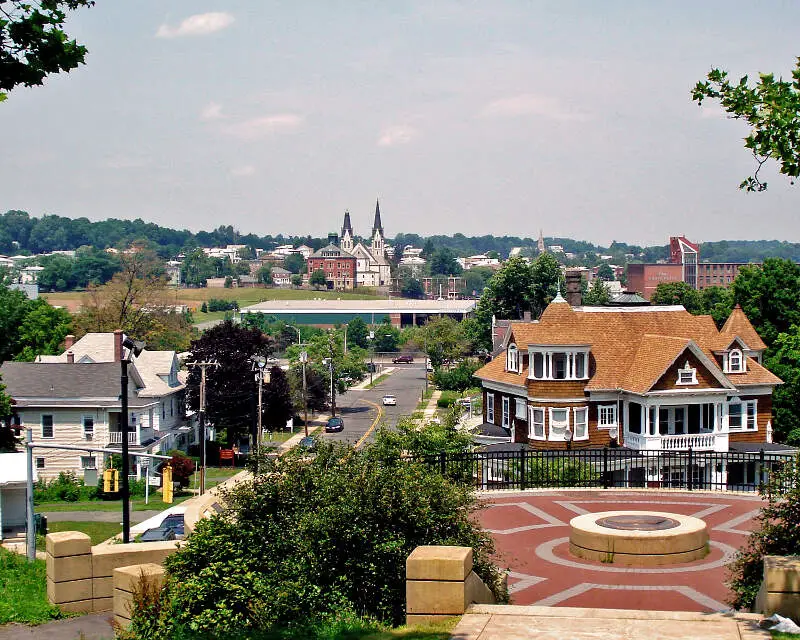
New Britain, CT
Demographics And Statistics
Living In New Britain, Connecticut Summary
Life in New Britain research summary. HomeSnacks has been using Saturday Night Science to research the quality of life in New Britain over the past nine years using Census, FBI, Zillow, and other primary data sources. Based on the most recently available data, we found the following about life in New Britain:
The population in New Britain is 74,212.
The median home value in New Britain is $251,760.
The median income in New Britain is $53,766.
The cost of living in New Britain is 102 which is 1.0x higher than the national average.
The median rent in New Britain is $1,136.
The unemployment rate in New Britain is 8.9%.
The poverty rate in New Britain is 19.7%.
The average high in New Britain is 60.1° and the average low is 39.7°.
New Britain SnackAbility
Overall SnackAbility
New Britain, CT Crime Report
Crime in New Britain summary. We use data from the FBI to determine the crime rates in New Britain. Key points include:
There were 1,785 total crimes in New Britain in the last reporting year.
The overall crime rate per 100,000 people in New Britain is 2,424.6 / 100k people.
The violent crime rate per 100,000 people in New Britain is 362.7 / 100k people.
The property crime rate per 100,000 people in New Britain is 2,061.9 / 100k people.
Overall, crime in New Britain is 4.32% above the national average.
Total Crimes
Above National Average
Crime In New Britain Comparison Table
| Statistic | Count Raw |
New Britain / 100k People |
Connecticut / 100k People |
National / 100k People |
|---|---|---|---|---|
| Total Crimes Per 100K | 1,785 | 2,424.6 | 1,746.7 | 2,324.2 |
| Violent Crime | 267 | 362.7 | 181.6 | 369.8 |
| Murder | 3 | 4.1 | 3.9 | 6.3 |
| Robbery | 49 | 66.6 | 57.2 | 66.1 |
| Aggravated Assault | 175 | 237.7 | 103.8 | 268.2 |
| Property Crime | 1,518 | 2,061.9 | 1,565.1 | 1,954.4 |
| Burglary | 178 | 241.8 | 187.1 | 269.8 |
| Larceny | 1,103 | 1,498.2 | 1,141.2 | 1,401.9 |
| Car Theft | 237 | 321.9 | 236.8 | 282.7 |
New Britain, CT Cost Of Living
Cost of living in New Britain summary. We use data on the cost of living to determine how expensive it is to live in New Britain. Real estate prices drive most of the variance in cost of living around Connecticut. Key points include:
The cost of living in New Britain is 102 with 100 being average.
The cost of living in New Britain is 1.0x higher than the national average.
The median home value in New Britain is $251,760.
The median income in New Britain is $53,766.
New Britain's Overall Cost Of Living
Higher Than The National Average
Cost Of Living In New Britain Comparison Table
| Living Expense | New Britain | Connecticut | National Average | |
|---|---|---|---|---|
| Overall | 102 | 114 | 100 | |
| Services | 113 | 113 | 100 | |
| Groceries | 104 | 101 | 100 | |
| Health | 94 | 107 | 100 | |
| Housing | 90 | 123 | 100 | |
| Transportation | 105 | 104 | 100 | |
| Utilities | 128 | 127 | 100 | |
New Britain, CT Weather
The average high in New Britain is 60.1° and the average low is 39.7°.
There are 76.8 days of precipitation each year.
Expect an average of 47.8 inches of precipitation each year with 39.3 inches of snow.
| Stat | New Britain |
|---|---|
| Average Annual High | 60.1 |
| Average Annual Low | 39.7 |
| Annual Precipitation Days | 76.8 |
| Average Annual Precipitation | 47.8 |
| Average Annual Snowfall | 39.3 |
Average High
Days of Rain
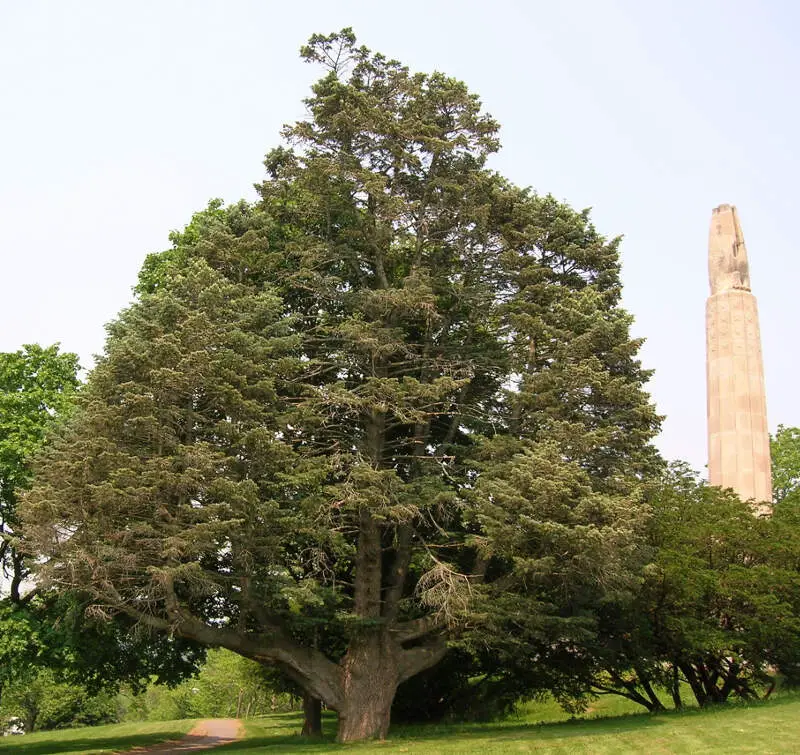
New Britain, CT Photos
2 Reviews & Comments About New Britain
/5

Jeffrey Gajda -
I live in New Britain and I never went to the high school or middle school so I went to a magnet school in Hartford. New Britain has high taxes really high taxes.
Chevon Avont'e -
I live in new Britain it ain't that bad here wtf !,!,
Rankings for New Britain in Connecticut


Locations Around New Britain
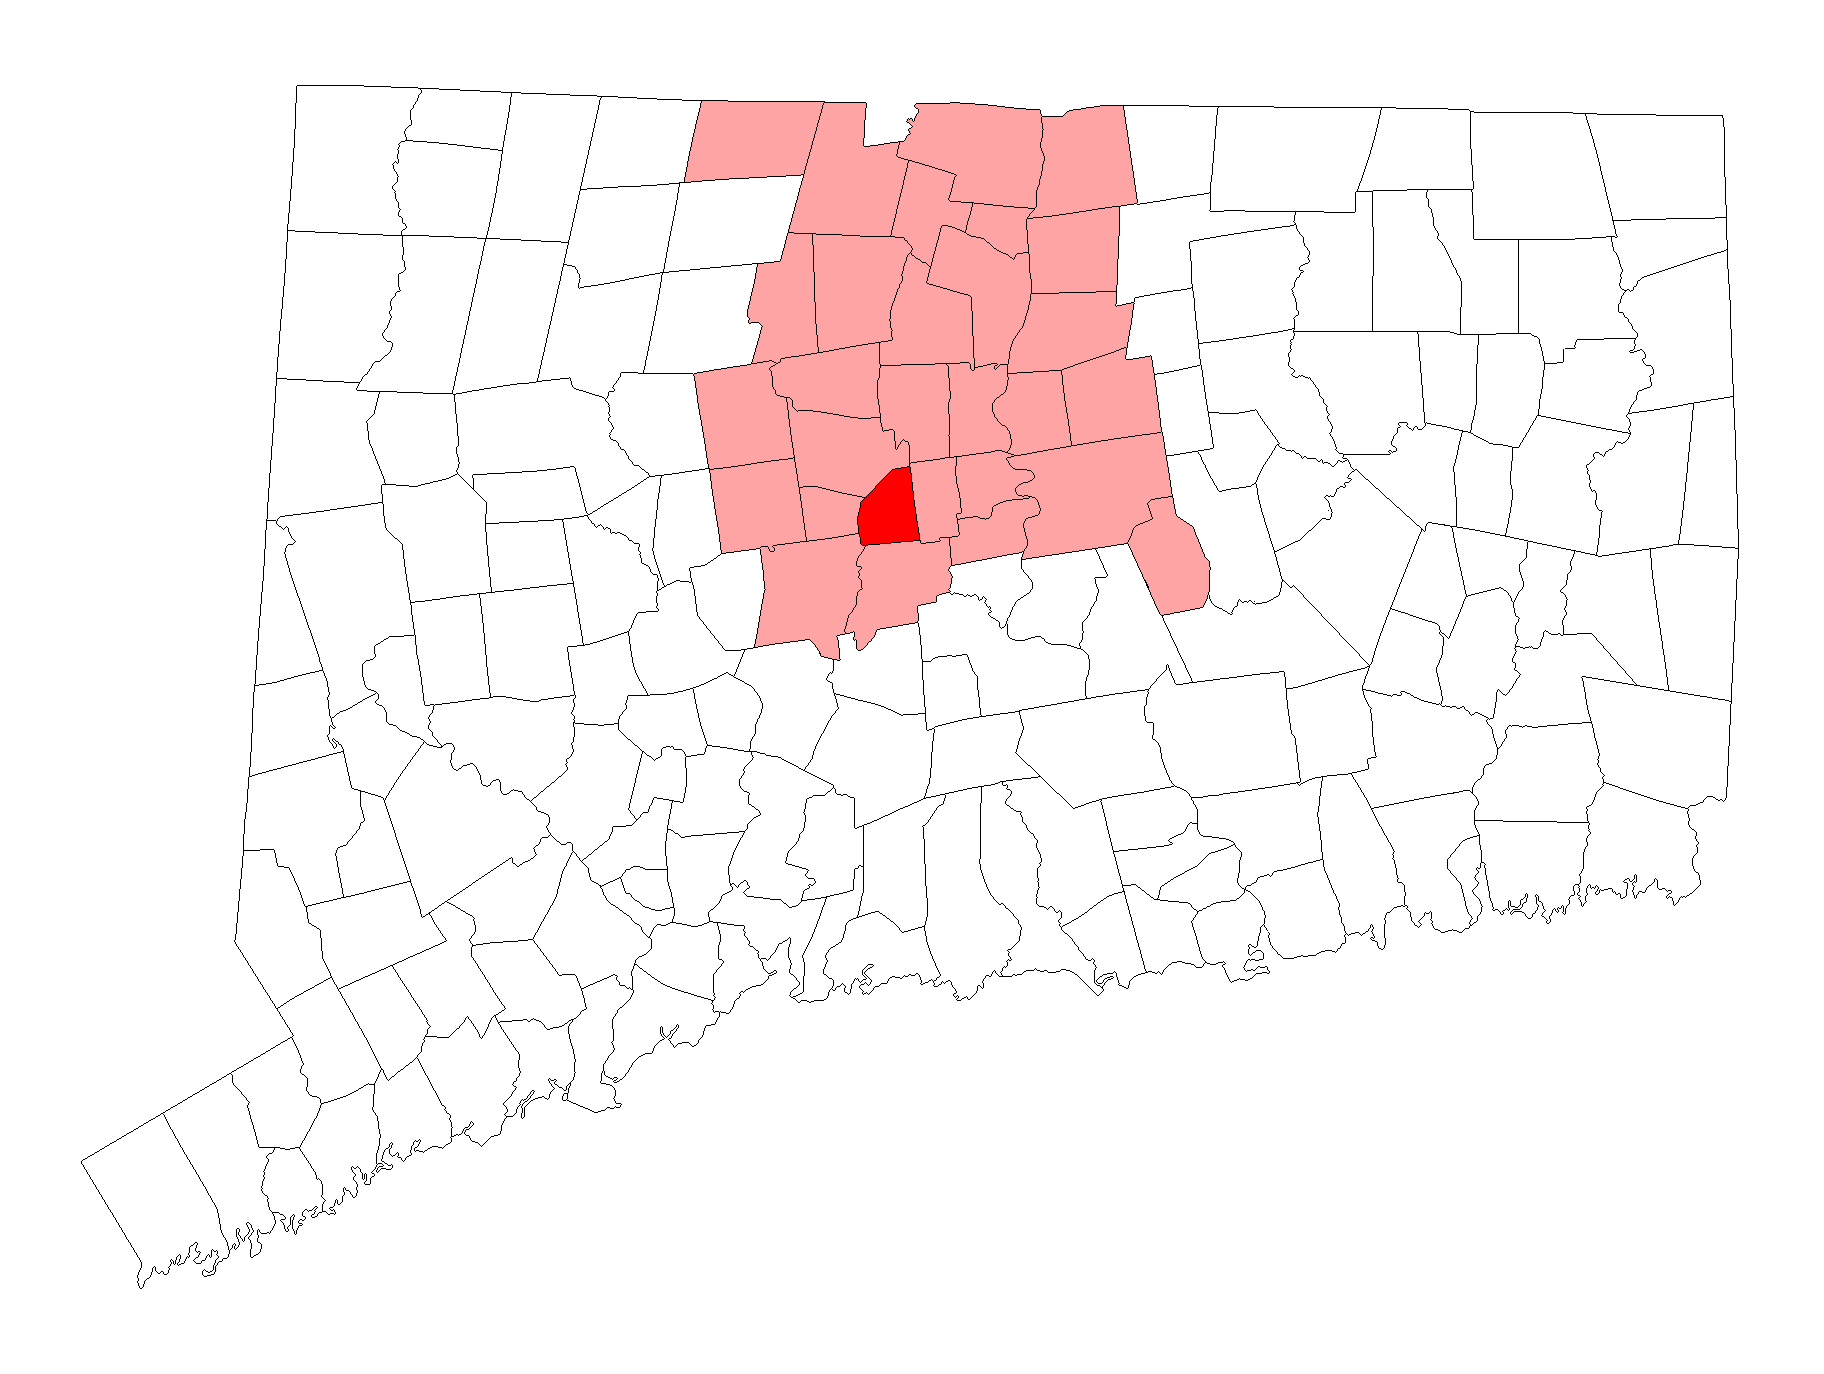
Map Of New Britain, CT
Best Places Around New Britain
Oakville, CT
Population 9,387
Kensington, CT
Population 9,580
West Hartford, CT
Population 64,088
Wethersfield, CT
Population 27,192
Newington, CT
Population 30,458
Windsor Locks, CT
Population 12,563
New Britain Demographics And Statistics
Population over time in New Britain
The current population in New Britain is 74,212. The population has increased 1.7% from 2010.
| Year | Population | % Change |
|---|---|---|
| 2022 | 74,212 | 1.9% |
| 2021 | 72,839 | -0.3% |
| 2020 | 73,069 | 0.3% |
| 2019 | 72,876 | -0.2% |
| 2018 | 72,988 | -0.1% |
| 2017 | 73,095 | -0.0% |
| 2016 | 73,112 | -0.0% |
| 2015 | 73,122 | 0.1% |
| 2014 | 73,055 | 0.1% |
| 2013 | 72,954 | - |
Race / Ethnicity in New Britain
New Britain is:
37.9% White with 28,118 White residents.
11.0% African American with 8,160 African American residents.
0.0% American Indian with 11 American Indian residents.
2.6% Asian with 1,938 Asian residents.
0.0% Hawaiian with 24 Hawaiian residents.
0.3% Other with 248 Other residents.
3.8% Two Or More with 2,803 Two Or More residents.
44.3% Hispanic with 32,910 Hispanic residents.
| Race | New Britain | CT | USA |
|---|---|---|---|
| White | 37.9% | 63.9% | 58.9% |
| African American | 11.0% | 9.9% | 12.1% |
| American Indian | 0.0% | 0.1% | 0.6% |
| Asian | 2.6% | 4.7% | 5.7% |
| Hawaiian | 0.0% | 0.0% | 0.2% |
| Other | 0.3% | 0.6% | 0.4% |
| Two Or More | 3.8% | 3.4% | 3.5% |
| Hispanic | 44.3% | 17.4% | 18.7% |
Gender in New Britain
New Britain is 51.5% female with 38,238 female residents.
New Britain is 48.5% male with 35,973 male residents.
| Gender | New Britain | CT | USA |
|---|---|---|---|
| Female | 51.5% | 51.0% | 50.4% |
| Male | 48.5% | 49.0% | 49.6% |
Highest level of educational attainment in New Britain for adults over 25
9.0% of adults in New Britain completed < 9th grade.
10.0% of adults in New Britain completed 9-12th grade.
34.0% of adults in New Britain completed high school / ged.
19.0% of adults in New Britain completed some college.
8.0% of adults in New Britain completed associate's degree.
12.0% of adults in New Britain completed bachelor's degree.
6.0% of adults in New Britain completed master's degree.
1.0% of adults in New Britain completed professional degree.
1.0% of adults in New Britain completed doctorate degree.
| Education | New Britain | CT | USA |
|---|---|---|---|
| < 9th Grade | 9.0% | 3.0% | 4.0% |
| 9-12th Grade | 10.0% | 5.0% | 6.0% |
| High School / GED | 34.0% | 26.0% | 26.0% |
| Some College | 19.0% | 16.0% | 20.0% |
| Associate's Degree | 8.0% | 8.0% | 9.0% |
| Bachelor's Degree | 12.0% | 23.0% | 21.0% |
| Master's Degree | 6.0% | 14.0% | 10.0% |
| Professional Degree | 1.0% | 3.0% | 2.0% |
| Doctorate Degree | 1.0% | 2.0% | 2.0% |
Household Income For New Britain, Connecticut
6.4% of households in New Britain earn Less than $10,000.
6.4% of households in New Britain earn $10,000 to $14,999.
10.8% of households in New Britain earn $15,000 to $24,999.
10.3% of households in New Britain earn $25,000 to $34,999.
13.3% of households in New Britain earn $35,000 to $49,999.
16.9% of households in New Britain earn $50,000 to $74,999.
11.4% of households in New Britain earn $75,000 to $99,999.
14.9% of households in New Britain earn $100,000 to $149,999.
4.8% of households in New Britain earn $150,000 to $199,999.
4.9% of households in New Britain earn $200,000 or more.
| Income | New Britain | CT | USA |
|---|---|---|---|
| Less than $10,000 | 6.4% | 4.3% | 4.9% |
| $10,000 to $14,999 | 6.4% | 3.4% | 3.8% |
| $15,000 to $24,999 | 10.8% | 6.0% | 7.0% |
| $25,000 to $34,999 | 10.3% | 6.0% | 7.4% |
| $35,000 to $49,999 | 13.3% | 8.9% | 10.7% |
| $50,000 to $74,999 | 16.9% | 13.9% | 16.1% |
| $75,000 to $99,999 | 11.4% | 12.0% | 12.8% |
| $100,000 to $149,999 | 14.9% | 17.8% | 17.1% |
| $150,000 to $199,999 | 4.8% | 10.8% | 8.8% |
| $200,000 or more | 4.9% | 17.0% | 11.4% |


