Fort Meade, FL
Demographics And Statistics
Living In Fort Meade, Florida Summary
Life in Fort Meade research summary. HomeSnacks has been using Saturday Night Science to research the quality of life in Fort Meade over the past nine years using Census, FBI, Zillow, and other primary data sources. Based on the most recently available data, we found the following about life in Fort Meade:
The population in Fort Meade is 5,133.
The median home value in Fort Meade is $219,967.
The median income in Fort Meade is $34,474.
The cost of living in Fort Meade is 87 which is 0.9x lower than the national average.
The median rent in Fort Meade is $846.
The unemployment rate in Fort Meade is 9.2%.
The poverty rate in Fort Meade is 23.0%.
The average high in Fort Meade is 83.8° and the average low is 61.5°.
Table Of Contents
Fort Meade SnackAbility
Overall SnackAbility
Fort Meade, FL Cost Of Living
Cost of living in Fort Meade summary. We use data on the cost of living to determine how expensive it is to live in Fort Meade. Real estate prices drive most of the variance in cost of living around Florida. Key points include:
The cost of living in Fort Meade is 87 with 100 being average.
The cost of living in Fort Meade is 0.9x lower than the national average.
The median home value in Fort Meade is $219,967.
The median income in Fort Meade is $34,474.
Fort Meade's Overall Cost Of Living
Lower Than The National Average
Cost Of Living In Fort Meade Comparison Table
| Living Expense | Fort Meade | Florida | National Average | |
|---|---|---|---|---|
| Overall | 87 | 101 | 100 | |
| Services | 101 | 98 | 100 | |
| Groceries | 110 | 101 | 100 | |
| Health | 94 | 96 | 100 | |
| Housing | 49 | 108 | 100 | |
| Transportation | 99 | 98 | 100 | |
| Utilities | 95 | 100 | 100 | |
Fort Meade, FL Weather
The average high in Fort Meade is 83.8° and the average low is 61.5°.
There are 75.2 days of precipitation each year.
Expect an average of 50.6 inches of precipitation each year with 0.0 inches of snow.
| Stat | Fort Meade |
|---|---|
| Average Annual High | 83.8 |
| Average Annual Low | 61.5 |
| Annual Precipitation Days | 75.2 |
| Average Annual Precipitation | 50.6 |
| Average Annual Snowfall | 0.0 |
Average High
Days of Rain
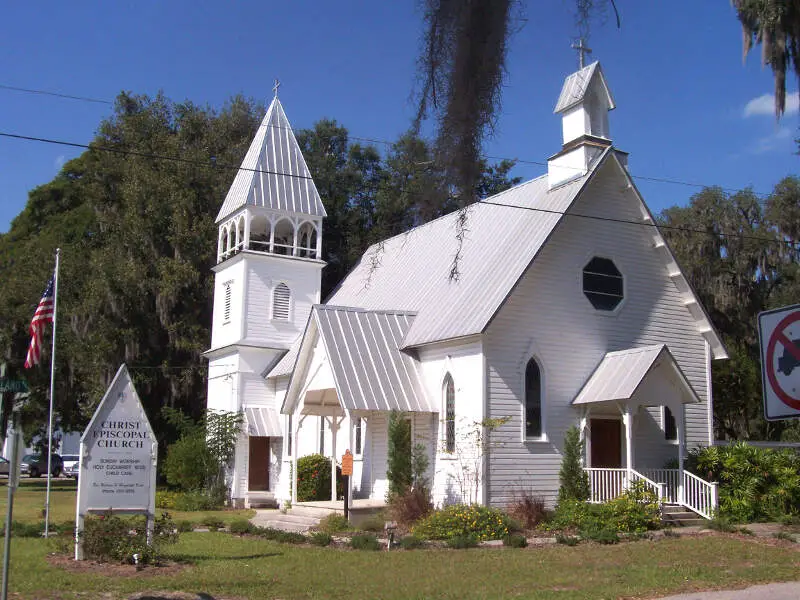
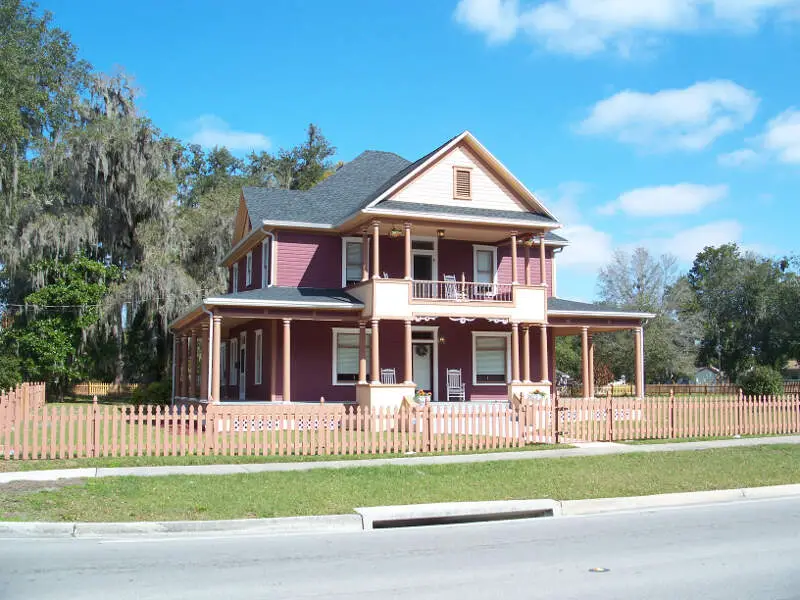
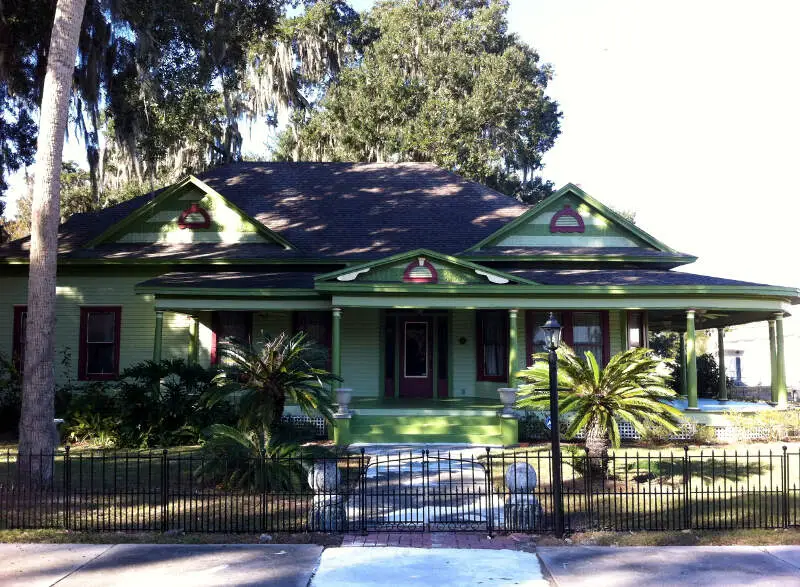
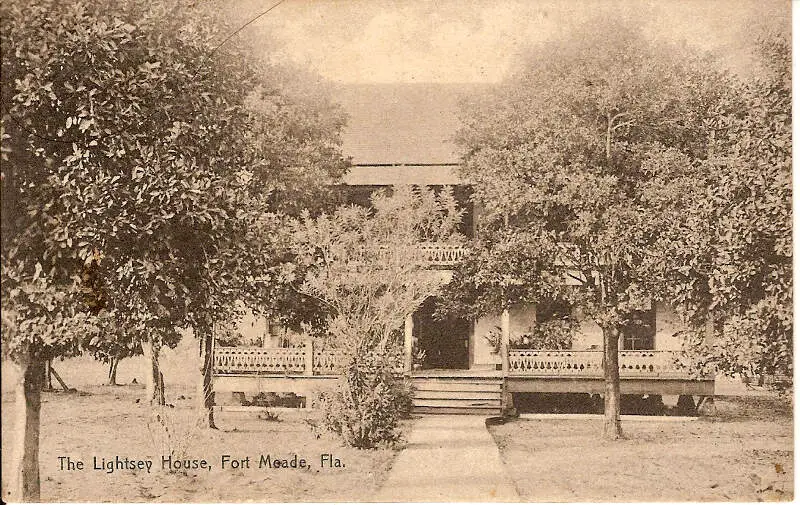
Fort Meade, FL Photos
Rankings for Fort Meade in Florida


Locations Around Fort Meade
Map Of Fort Meade, FL
Best Places Around Fort Meade
Lakeland Highlands, FL
Population 11,276
Highland, IL
Population 10,215
Bartow, FL
Population 19,424
Lake Wales, FL
Population 16,455
Winter Haven, FL
Population 50,778
Fort Meade Demographics And Statistics
Population over time in Fort Meade
The current population in Fort Meade is 5,133. The population has decreased -10.1% from 2010.
| Year | Population | % Change |
|---|---|---|
| 2022 | 5,133 | -14.6% |
| 2021 | 6,013 | 1.3% |
| 2020 | 5,938 | 0.9% |
| 2019 | 5,883 | 1.0% |
| 2018 | 5,824 | 1.4% |
| 2017 | 5,745 | 0.3% |
| 2016 | 5,725 | 0.5% |
| 2015 | 5,699 | -0.1% |
| 2014 | 5,702 | -0.1% |
| 2013 | 5,709 | - |
Race / Ethnicity in Fort Meade
Fort Meade is:
54.9% White with 2,817 White residents.
15.6% African American with 803 African American residents.
0.3% American Indian with 14 American Indian residents.
0.1% Asian with 6 Asian residents.
0.0% Hawaiian with 0 Hawaiian residents.
0.2% Other with 8 Other residents.
1.3% Two Or More with 69 Two Or More residents.
27.6% Hispanic with 1,416 Hispanic residents.
| Race | Fort Meade | FL | USA |
|---|---|---|---|
| White | 54.9% | 52.0% | 58.9% |
| African American | 15.6% | 14.9% | 12.1% |
| American Indian | 0.3% | 0.1% | 0.6% |
| Asian | 0.1% | 2.8% | 5.7% |
| Hawaiian | 0.0% | 0.1% | 0.2% |
| Other | 0.2% | 0.5% | 0.4% |
| Two Or More | 1.3% | 3.1% | 3.5% |
| Hispanic | 27.6% | 26.5% | 18.7% |
Gender in Fort Meade
Fort Meade is 51.6% female with 2,651 female residents.
Fort Meade is 48.4% male with 2,482 male residents.
| Gender | Fort Meade | FL | USA |
|---|---|---|---|
| Female | 51.6% | 50.8% | 50.4% |
| Male | 48.4% | 49.2% | 49.6% |
Highest level of educational attainment in Fort Meade for adults over 25
7.0% of adults in Fort Meade completed < 9th grade.
11.0% of adults in Fort Meade completed 9-12th grade.
47.0% of adults in Fort Meade completed high school / ged.
17.0% of adults in Fort Meade completed some college.
8.0% of adults in Fort Meade completed associate's degree.
5.0% of adults in Fort Meade completed bachelor's degree.
4.0% of adults in Fort Meade completed master's degree.
0.0% of adults in Fort Meade completed professional degree.
1.0% of adults in Fort Meade completed doctorate degree.
| Education | Fort Meade | FL | USA |
|---|---|---|---|
| < 9th Grade | 7.0% | 6.0% | 4.0% |
| 9-12th Grade | 11.0% | 6.0% | 6.0% |
| High School / GED | 47.0% | 28.0% | 26.0% |
| Some College | 17.0% | 19.0% | 20.0% |
| Associate's Degree | 8.0% | 10.0% | 9.0% |
| Bachelor's Degree | 5.0% | 20.0% | 21.0% |
| Master's Degree | 4.0% | 8.0% | 10.0% |
| Professional Degree | 0.0% | 2.0% | 2.0% |
| Doctorate Degree | 1.0% | 1.0% | 2.0% |
Household Income For Fort Meade, Florida
9.0% of households in Fort Meade earn Less than $10,000.
6.6% of households in Fort Meade earn $10,000 to $14,999.
16.4% of households in Fort Meade earn $15,000 to $24,999.
19.0% of households in Fort Meade earn $25,000 to $34,999.
11.7% of households in Fort Meade earn $35,000 to $49,999.
10.5% of households in Fort Meade earn $50,000 to $74,999.
10.1% of households in Fort Meade earn $75,000 to $99,999.
10.9% of households in Fort Meade earn $100,000 to $149,999.
4.2% of households in Fort Meade earn $150,000 to $199,999.
1.7% of households in Fort Meade earn $200,000 or more.
| Income | Fort Meade | FL | USA |
|---|---|---|---|
| Less than $10,000 | 9.0% | 5.2% | 4.9% |
| $10,000 to $14,999 | 6.6% | 3.7% | 3.8% |
| $15,000 to $24,999 | 16.4% | 7.6% | 7.0% |
| $25,000 to $34,999 | 19.0% | 8.3% | 7.4% |
| $35,000 to $49,999 | 11.7% | 12.1% | 10.7% |
| $50,000 to $74,999 | 10.5% | 17.6% | 16.1% |
| $75,000 to $99,999 | 10.1% | 13.2% | 12.8% |
| $100,000 to $149,999 | 10.9% | 16.0% | 17.1% |
| $150,000 to $199,999 | 4.2% | 7.4% | 8.8% |
| $200,000 or more | 1.7% | 9.0% | 11.4% |


