Hallandale Beach, FL
Demographics And Statistics
Living In Hallandale Beach, Florida Summary
Life in Hallandale Beach research summary. HomeSnacks has been using Saturday Night Science to research the quality of life in Hallandale Beach over the past nine years using Census, FBI, Zillow, and other primary data sources. Based on the most recently available data, we found the following about life in Hallandale Beach:
The population in Hallandale Beach is 41,102.
The median home value in Hallandale Beach is $328,630.
The median income in Hallandale Beach is $45,417.
The cost of living in Hallandale Beach is 105 which is 1.1x higher than the national average.
The median rent in Hallandale Beach is $1,457.
The unemployment rate in Hallandale Beach is 9.3%.
The poverty rate in Hallandale Beach is 20.9%.
The average high in Hallandale Beach is 83.2° and the average low is 69.6°.
Hallandale Beach SnackAbility
Overall SnackAbility
Hallandale Beach, FL Crime Report
Crime in Hallandale Beach summary. We use data from the FBI to determine the crime rates in Hallandale Beach. Key points include:
There were 1,247 total crimes in Hallandale Beach in the last reporting year.
The overall crime rate per 100,000 people in Hallandale Beach is 3,105.6 / 100k people.
The violent crime rate per 100,000 people in Hallandale Beach is 498.1 / 100k people.
The property crime rate per 100,000 people in Hallandale Beach is 2,607.5 / 100k people.
Overall, crime in Hallandale Beach is 33.62% above the national average.
Total Crimes
Above National Average
Crime In Hallandale Beach Comparison Table
| Statistic | Count Raw |
Hallandale Beach / 100k People |
Florida / 100k People |
National / 100k People |
|---|---|---|---|---|
| Total Crimes Per 100K | 1,247 | 3,105.6 | 2,153.0 | 2,324.2 |
| Violent Crime | 200 | 498.1 | 383.6 | 369.8 |
| Murder | 10 | 24.9 | 5.9 | 6.3 |
| Robbery | 46 | 114.6 | 62.2 | 66.1 |
| Aggravated Assault | 128 | 318.8 | 280.1 | 268.2 |
| Property Crime | 1,047 | 2,607.5 | 1,769.4 | 1,954.4 |
| Burglary | 136 | 338.7 | 240.6 | 269.8 |
| Larceny | 763 | 1,900.2 | 1,352.7 | 1,401.9 |
| Car Theft | 148 | 368.6 | 176.1 | 282.7 |
Hallandale Beach, FL Cost Of Living
Cost of living in Hallandale Beach summary. We use data on the cost of living to determine how expensive it is to live in Hallandale Beach. Real estate prices drive most of the variance in cost of living around Florida. Key points include:
The cost of living in Hallandale Beach is 105 with 100 being average.
The cost of living in Hallandale Beach is 1.1x higher than the national average.
The median home value in Hallandale Beach is $328,630.
The median income in Hallandale Beach is $45,417.
Hallandale Beach's Overall Cost Of Living
Higher Than The National Average
Cost Of Living In Hallandale Beach Comparison Table
| Living Expense | Hallandale Beach | Florida | National Average | |
|---|---|---|---|---|
| Overall | 105 | 101 | 100 | |
| Services | 106 | 98 | 100 | |
| Groceries | 119 | 101 | 100 | |
| Health | 96 | 96 | 100 | |
| Housing | 98 | 108 | 100 | |
| Transportation | 106 | 98 | 100 | |
| Utilities | 107 | 100 | 100 | |
Hallandale Beach, FL Weather
The average high in Hallandale Beach is 83.2° and the average low is 69.6°.
There are 93.9 days of precipitation each year.
Expect an average of 59.3 inches of precipitation each year with 0.0 inches of snow.
| Stat | Hallandale Beach |
|---|---|
| Average Annual High | 83.2 |
| Average Annual Low | 69.6 |
| Annual Precipitation Days | 93.9 |
| Average Annual Precipitation | 59.3 |
| Average Annual Snowfall | 0.0 |
Average High
Days of Rain
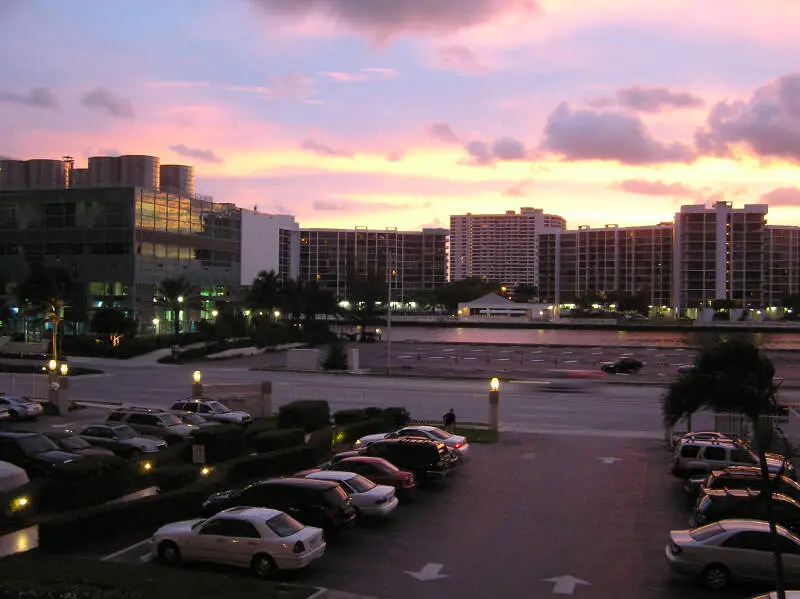
Hallandale Beach, FL Photos
2 Reviews & Comments About Hallandale Beach
/5

HomeSnacks User - 2018-08-01 14:41:31.353331
I dont like hallandale beach they are really rude and disrespectful and so are the police they are really racist.
They are racist and disrespectful in this city the only good thing about this city is the beach its very nice
HomeSnacks User - 2018-09-10 16:35:45.860477
This is the worst place to live alot of racist people and racist police as well.
Alot of racism and racist police officers
Rankings for Hallandale Beach in Florida


Locations Around Hallandale Beach
Map Of Hallandale Beach, FL
Best Places Around Hallandale Beach
Weston, FL
Population 68,029
Coral Terrace, FL
Population 24,597
Pembroke Pines, FL
Population 170,472
Miami Lakes, FL
Population 30,621
Davie, FL
Population 105,821
Oakland Park, FL
Population 44,056
North Lauderdale, FL
Population 44,635
Hialeah Gardens, FL
Population 22,815
West Park, FL
Population 15,074
Ojus, FL
Population 16,450
Hallandale Beach Demographics And Statistics
Population over time in Hallandale Beach
The current population in Hallandale Beach is 41,102. The population has increased 11.8% from 2010.
| Year | Population | % Change |
|---|---|---|
| 2022 | 41,102 | 4.1% |
| 2021 | 39,472 | 0.5% |
| 2020 | 39,285 | 0.9% |
| 2019 | 38,951 | 0.6% |
| 2018 | 38,725 | 1.2% |
| 2017 | 38,270 | 1.4% |
| 2016 | 37,758 | 1.1% |
| 2015 | 37,343 | 1.0% |
| 2014 | 36,956 | 0.5% |
| 2013 | 36,754 | - |
Race / Ethnicity in Hallandale Beach
Hallandale Beach is:
38.6% White with 15,855 White residents.
18.4% African American with 7,553 African American residents.
0.1% American Indian with 59 American Indian residents.
1.5% Asian with 632 Asian residents.
0.4% Hawaiian with 169 Hawaiian residents.
0.4% Other with 172 Other residents.
2.2% Two Or More with 890 Two Or More residents.
38.4% Hispanic with 15,772 Hispanic residents.
| Race | Hallandale Beach | FL | USA |
|---|---|---|---|
| White | 38.6% | 52.0% | 58.9% |
| African American | 18.4% | 14.9% | 12.1% |
| American Indian | 0.1% | 0.1% | 0.6% |
| Asian | 1.5% | 2.8% | 5.7% |
| Hawaiian | 0.4% | 0.1% | 0.2% |
| Other | 0.4% | 0.5% | 0.4% |
| Two Or More | 2.2% | 3.1% | 3.5% |
| Hispanic | 38.4% | 26.5% | 18.7% |
Gender in Hallandale Beach
Hallandale Beach is 53.0% female with 21,803 female residents.
Hallandale Beach is 47.0% male with 19,299 male residents.
| Gender | Hallandale Beach | FL | USA |
|---|---|---|---|
| Female | 53.0% | 50.8% | 50.4% |
| Male | 47.0% | 49.2% | 49.6% |
Highest level of educational attainment in Hallandale Beach for adults over 25
5.0% of adults in Hallandale Beach completed < 9th grade.
7.0% of adults in Hallandale Beach completed 9-12th grade.
28.0% of adults in Hallandale Beach completed high school / ged.
15.0% of adults in Hallandale Beach completed some college.
9.0% of adults in Hallandale Beach completed associate's degree.
21.0% of adults in Hallandale Beach completed bachelor's degree.
9.0% of adults in Hallandale Beach completed master's degree.
4.0% of adults in Hallandale Beach completed professional degree.
2.0% of adults in Hallandale Beach completed doctorate degree.
| Education | Hallandale Beach | FL | USA |
|---|---|---|---|
| < 9th Grade | 5.0% | 6.0% | 4.0% |
| 9-12th Grade | 7.0% | 6.0% | 6.0% |
| High School / GED | 28.0% | 28.0% | 26.0% |
| Some College | 15.0% | 19.0% | 20.0% |
| Associate's Degree | 9.0% | 10.0% | 9.0% |
| Bachelor's Degree | 21.0% | 20.0% | 21.0% |
| Master's Degree | 9.0% | 8.0% | 10.0% |
| Professional Degree | 4.0% | 2.0% | 2.0% |
| Doctorate Degree | 2.0% | 1.0% | 2.0% |
Household Income For Hallandale Beach, Florida
11.8% of households in Hallandale Beach earn Less than $10,000.
6.6% of households in Hallandale Beach earn $10,000 to $14,999.
10.5% of households in Hallandale Beach earn $15,000 to $24,999.
10.0% of households in Hallandale Beach earn $25,000 to $34,999.
15.7% of households in Hallandale Beach earn $35,000 to $49,999.
14.5% of households in Hallandale Beach earn $50,000 to $74,999.
9.5% of households in Hallandale Beach earn $75,000 to $99,999.
13.0% of households in Hallandale Beach earn $100,000 to $149,999.
3.3% of households in Hallandale Beach earn $150,000 to $199,999.
5.1% of households in Hallandale Beach earn $200,000 or more.
| Income | Hallandale Beach | FL | USA |
|---|---|---|---|
| Less than $10,000 | 11.8% | 5.2% | 4.9% |
| $10,000 to $14,999 | 6.6% | 3.7% | 3.8% |
| $15,000 to $24,999 | 10.5% | 7.6% | 7.0% |
| $25,000 to $34,999 | 10.0% | 8.3% | 7.4% |
| $35,000 to $49,999 | 15.7% | 12.1% | 10.7% |
| $50,000 to $74,999 | 14.5% | 17.6% | 16.1% |
| $75,000 to $99,999 | 9.5% | 13.2% | 12.8% |
| $100,000 to $149,999 | 13.0% | 16.0% | 17.1% |
| $150,000 to $199,999 | 3.3% | 7.4% | 8.8% |
| $200,000 or more | 5.1% | 9.0% | 11.4% |


