Inverness, FL
Demographics And Statistics
Living In Inverness, Florida Summary
Life in Inverness research summary. HomeSnacks has been using Saturday Night Science to research the quality of life in Inverness over the past nine years using Census, FBI, Zillow, and other primary data sources. Based on the most recently available data, we found the following about life in Inverness:
The population in Inverness is 7,602.
The median home value in Inverness is $246,176.
The median income in Inverness is $42,282.
The cost of living in Inverness is 86 which is 0.9x lower than the national average.
The median rent in Inverness is $911.
The unemployment rate in Inverness is 7.2%.
The poverty rate in Inverness is 15.3%.
The average high in Inverness is 82.1° and the average low is 58.9°.
Table Of Contents
Inverness SnackAbility
Overall SnackAbility
Inverness, FL Cost Of Living
Cost of living in Inverness summary. We use data on the cost of living to determine how expensive it is to live in Inverness. Real estate prices drive most of the variance in cost of living around Florida. Key points include:
The cost of living in Inverness is 86 with 100 being average.
The cost of living in Inverness is 0.9x lower than the national average.
The median home value in Inverness is $246,176.
The median income in Inverness is $42,282.
Inverness's Overall Cost Of Living
Lower Than The National Average
Cost Of Living In Inverness Comparison Table
| Living Expense | Inverness | Florida | National Average | |
|---|---|---|---|---|
| Overall | 86 | 101 | 100 | |
| Services | 90 | 98 | 100 | |
| Groceries | 98 | 101 | 100 | |
| Health | 100 | 96 | 100 | |
| Housing | 59 | 108 | 100 | |
| Transportation | 101 | 98 | 100 | |
| Utilities | 90 | 100 | 100 | |
Inverness, FL Weather
The average high in Inverness is 82.1° and the average low is 58.9°.
There are 73.9 days of precipitation each year.
Expect an average of 52.1 inches of precipitation each year with 0.0 inches of snow.
| Stat | Inverness |
|---|---|
| Average Annual High | 82.1 |
| Average Annual Low | 58.9 |
| Annual Precipitation Days | 73.9 |
| Average Annual Precipitation | 52.1 |
| Average Annual Snowfall | 0.0 |
Average High
Days of Rain
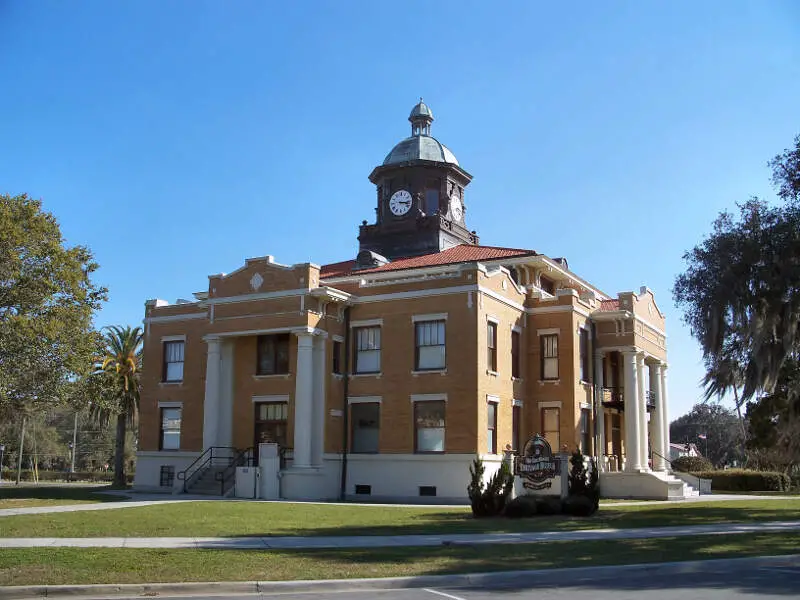
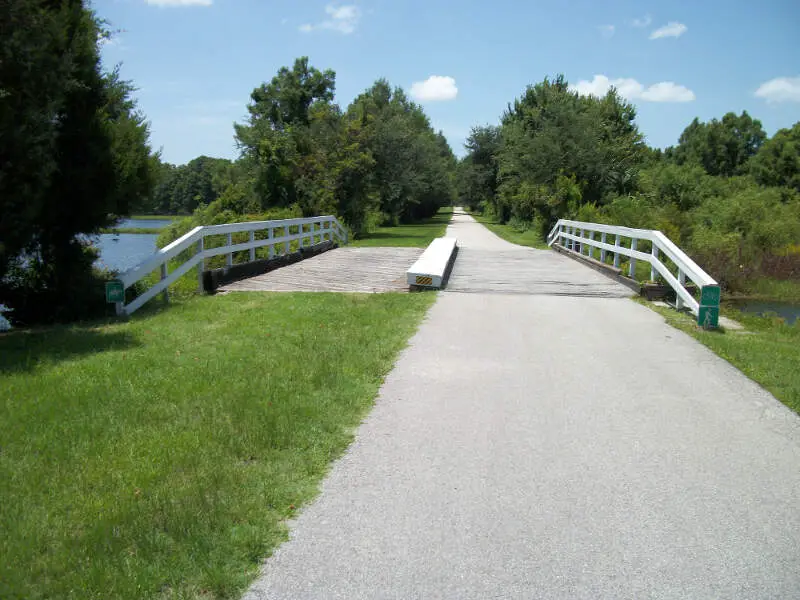
Inverness, FL Photos
Rankings for Inverness in Florida


Locations Around Inverness
Map Of Inverness, FL
Best Places Around Inverness
Winter Garden, FL
Population 46,518
The Villages, FL
Population 79,108
Trinity, FL
Population 18,672
Lutz, FL
Population 24,721
Land O' Lakes, FL
Population 40,843
Spring Hill, FL
Population 116,882
Wesley Chapel, FL
Population 68,814
Tavares, FL
Population 19,088
Lady Lake, FL
Population 16,047
Cheval, FL
Population 13,189
Inverness Demographics And Statistics
Population over time in Inverness
The current population in Inverness is 7,602. The population has increased 3.9% from 2010.
| Year | Population | % Change |
|---|---|---|
| 2022 | 7,602 | 5.3% |
| 2021 | 7,216 | 0.7% |
| 2020 | 7,164 | -0.6% |
| 2019 | 7,204 | 0.3% |
| 2018 | 7,184 | -0.3% |
| 2017 | 7,205 | -0.3% |
| 2016 | 7,230 | -0.4% |
| 2015 | 7,259 | -0.1% |
| 2014 | 7,269 | -0.7% |
| 2013 | 7,320 | - |
Race / Ethnicity in Inverness
Inverness is:
83.5% White with 6,347 White residents.
3.0% African American with 225 African American residents.
0.3% American Indian with 24 American Indian residents.
3.8% Asian with 292 Asian residents.
0.0% Hawaiian with 0 Hawaiian residents.
0.0% Other with 0 Other residents.
1.5% Two Or More with 114 Two Or More residents.
7.9% Hispanic with 600 Hispanic residents.
| Race | Inverness | FL | USA |
|---|---|---|---|
| White | 83.5% | 52.0% | 58.9% |
| African American | 3.0% | 14.9% | 12.1% |
| American Indian | 0.3% | 0.1% | 0.6% |
| Asian | 3.8% | 2.8% | 5.7% |
| Hawaiian | 0.0% | 0.1% | 0.2% |
| Other | 0.0% | 0.5% | 0.4% |
| Two Or More | 1.5% | 3.1% | 3.5% |
| Hispanic | 7.9% | 26.5% | 18.7% |
Gender in Inverness
Inverness is 56.3% female with 4,282 female residents.
Inverness is 43.7% male with 3,320 male residents.
| Gender | Inverness | FL | USA |
|---|---|---|---|
| Female | 56.3% | 50.8% | 50.4% |
| Male | 43.7% | 49.2% | 49.6% |
Highest level of educational attainment in Inverness for adults over 25
1.0% of adults in Inverness completed < 9th grade.
5.0% of adults in Inverness completed 9-12th grade.
34.0% of adults in Inverness completed high school / ged.
29.0% of adults in Inverness completed some college.
11.0% of adults in Inverness completed associate's degree.
13.0% of adults in Inverness completed bachelor's degree.
5.0% of adults in Inverness completed master's degree.
1.0% of adults in Inverness completed professional degree.
1.0% of adults in Inverness completed doctorate degree.
| Education | Inverness | FL | USA |
|---|---|---|---|
| < 9th Grade | 1.0% | 6.0% | 4.0% |
| 9-12th Grade | 5.0% | 6.0% | 6.0% |
| High School / GED | 34.0% | 28.0% | 26.0% |
| Some College | 29.0% | 19.0% | 20.0% |
| Associate's Degree | 11.0% | 10.0% | 9.0% |
| Bachelor's Degree | 13.0% | 20.0% | 21.0% |
| Master's Degree | 5.0% | 8.0% | 10.0% |
| Professional Degree | 1.0% | 2.0% | 2.0% |
| Doctorate Degree | 1.0% | 1.0% | 2.0% |
Household Income For Inverness, Florida
10.2% of households in Inverness earn Less than $10,000.
3.7% of households in Inverness earn $10,000 to $14,999.
13.1% of households in Inverness earn $15,000 to $24,999.
13.8% of households in Inverness earn $25,000 to $34,999.
19.8% of households in Inverness earn $35,000 to $49,999.
18.3% of households in Inverness earn $50,000 to $74,999.
7.6% of households in Inverness earn $75,000 to $99,999.
8.7% of households in Inverness earn $100,000 to $149,999.
3.4% of households in Inverness earn $150,000 to $199,999.
1.4% of households in Inverness earn $200,000 or more.
| Income | Inverness | FL | USA |
|---|---|---|---|
| Less than $10,000 | 10.2% | 5.2% | 4.9% |
| $10,000 to $14,999 | 3.7% | 3.7% | 3.8% |
| $15,000 to $24,999 | 13.1% | 7.6% | 7.0% |
| $25,000 to $34,999 | 13.8% | 8.3% | 7.4% |
| $35,000 to $49,999 | 19.8% | 12.1% | 10.7% |
| $50,000 to $74,999 | 18.3% | 17.6% | 16.1% |
| $75,000 to $99,999 | 7.6% | 13.2% | 12.8% |
| $100,000 to $149,999 | 8.7% | 16.0% | 17.1% |
| $150,000 to $199,999 | 3.4% | 7.4% | 8.8% |
| $200,000 or more | 1.4% | 9.0% | 11.4% |


