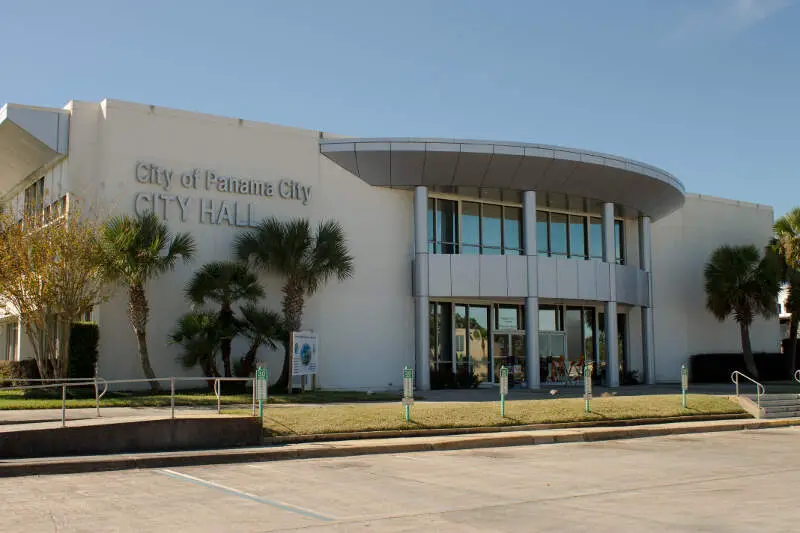
Panama City, FL
Demographics And Statistics
Living In Panama City, Florida Summary
Life in Panama City research summary. HomeSnacks has been using Saturday Night Science to research the quality of life in Panama City over the past nine years using Census, FBI, Zillow, and other primary data sources. Based on the most recently available data, we found the following about life in Panama City:
The population in Panama City is 34,254.
The median home value in Panama City is $275,540.
The median income in Panama City is $57,221.
The cost of living in Panama City is 91 which is 0.9x lower than the national average.
The median rent in Panama City is $1,221.
The unemployment rate in Panama City is 5.1%.
The poverty rate in Panama City is 18.6%.
The average high in Panama City is 78.0° and the average low is 58.8°.
Panama City SnackAbility
Overall SnackAbility
Panama City, FL Crime Report
Crime in Panama City summary. We use data from the FBI to determine the crime rates in Panama City. Key points include:
There were 1,269 total crimes in Panama City in the last reporting year.
The overall crime rate per 100,000 people in Panama City is 3,586.4 / 100k people.
The violent crime rate per 100,000 people in Panama City is 678.3 / 100k people.
The property crime rate per 100,000 people in Panama City is 2,908.1 / 100k people.
Overall, crime in Panama City is 54.31% above the national average.
Total Crimes
Above National Average
Crime In Panama City Comparison Table
| Statistic | Count Raw |
Panama City / 100k People |
Florida / 100k People |
National / 100k People |
|---|---|---|---|---|
| Total Crimes Per 100K | 1,269 | 3,586.4 | 2,153.0 | 2,324.2 |
| Violent Crime | 240 | 678.3 | 383.6 | 369.8 |
| Murder | 1 | 2.8 | 5.9 | 6.3 |
| Robbery | 17 | 48.0 | 62.2 | 66.1 |
| Aggravated Assault | 179 | 505.9 | 280.1 | 268.2 |
| Property Crime | 1,029 | 2,908.1 | 1,769.4 | 1,954.4 |
| Burglary | 168 | 474.8 | 240.6 | 269.8 |
| Larceny | 783 | 2,212.9 | 1,352.7 | 1,401.9 |
| Car Theft | 78 | 220.4 | 176.1 | 282.7 |
Panama City, FL Cost Of Living
Cost of living in Panama City summary. We use data on the cost of living to determine how expensive it is to live in Panama City. Real estate prices drive most of the variance in cost of living around Florida. Key points include:
The cost of living in Panama City is 91 with 100 being average.
The cost of living in Panama City is 0.9x lower than the national average.
The median home value in Panama City is $275,540.
The median income in Panama City is $57,221.
Panama City's Overall Cost Of Living
Lower Than The National Average
Cost Of Living In Panama City Comparison Table
| Living Expense | Panama City | Florida | National Average | |
|---|---|---|---|---|
| Overall | 91 | 101 | 100 | |
| Services | 105 | 98 | 100 | |
| Groceries | 107 | 101 | 100 | |
| Health | 102 | 96 | 100 | |
| Housing | 80 | 108 | 100 | |
| Transportation | 82 | 98 | 100 | |
| Utilities | 89 | 100 | 100 | |
Panama City, FL Weather
The average high in Panama City is 78.0° and the average low is 58.8°.
There are 78.2 days of precipitation each year.
Expect an average of 61.1 inches of precipitation each year with 0.0 inches of snow.
| Stat | Panama City |
|---|---|
| Average Annual High | 78.0 |
| Average Annual Low | 58.8 |
| Annual Precipitation Days | 78.2 |
| Average Annual Precipitation | 61.1 |
| Average Annual Snowfall | 0.0 |
Average High
Days of Rain
Panama City, FL Photos

1 Reviews & Comments About Panama City
/5

HomeSnacks User - 2019-05-09 20:15:58.332859
Crime is drug fueled and violent. Employment is still low paid, part time no benefits. Schools are poor and rapidly closing post hurricane Michael. I moved here from hurricane Katrina and have stayed in a HUD apartment complex for 13 years paying very low rent and utilities in a very poor neighborhood. I can leave whenever i wish.
Local parks and beaches are beautiful and a lot of us are volenteering to improve our local post hurricane Michael environment. A community is an endeavor by it's citizens, for positive changes to come to fruition. The environmental pollution needs to be managed better by the state authorities, to attract population growth.
Rankings for Panama City in Florida


Locations Around Panama City
Map Of Panama City, FL
Best Places Around Panama City
Panama City Demographics And Statistics
Population over time in Panama City
The current population in Panama City is 34,254. The population has decreased -6.9% from 2010.
| Year | Population | % Change |
|---|---|---|
| 2022 | 34,254 | -7.1% |
| 2021 | 36,880 | 0.6% |
| 2020 | 36,661 | 0.0% |
| 2019 | 36,654 | -0.7% |
| 2018 | 36,917 | 1.4% |
| 2017 | 36,405 | 0.6% |
| 2016 | 36,205 | 0.1% |
| 2015 | 36,153 | -1.4% |
| 2014 | 36,662 | -0.4% |
| 2013 | 36,795 | - |
Race / Ethnicity in Panama City
Panama City is:
61.8% White with 21,171 White residents.
21.1% African American with 7,226 African American residents.
0.2% American Indian with 72 American Indian residents.
1.3% Asian with 442 Asian residents.
0.2% Hawaiian with 71 Hawaiian residents.
1.6% Other with 551 Other residents.
5.2% Two Or More with 1,776 Two Or More residents.
8.6% Hispanic with 2,945 Hispanic residents.
| Race | Panama City | FL | USA |
|---|---|---|---|
| White | 61.8% | 52.0% | 58.9% |
| African American | 21.1% | 14.9% | 12.1% |
| American Indian | 0.2% | 0.1% | 0.6% |
| Asian | 1.3% | 2.8% | 5.7% |
| Hawaiian | 0.2% | 0.1% | 0.2% |
| Other | 1.6% | 0.5% | 0.4% |
| Two Or More | 5.2% | 3.1% | 3.5% |
| Hispanic | 8.6% | 26.5% | 18.7% |
Gender in Panama City
Panama City is 52.6% female with 18,014 female residents.
Panama City is 47.4% male with 16,240 male residents.
| Gender | Panama City | FL | USA |
|---|---|---|---|
| Female | 52.6% | 50.8% | 50.4% |
| Male | 47.4% | 49.2% | 49.6% |
Highest level of educational attainment in Panama City for adults over 25
5.0% of adults in Panama City completed < 9th grade.
6.0% of adults in Panama City completed 9-12th grade.
27.0% of adults in Panama City completed high school / ged.
25.0% of adults in Panama City completed some college.
11.0% of adults in Panama City completed associate's degree.
16.0% of adults in Panama City completed bachelor's degree.
7.0% of adults in Panama City completed master's degree.
2.0% of adults in Panama City completed professional degree.
1.0% of adults in Panama City completed doctorate degree.
| Education | Panama City | FL | USA |
|---|---|---|---|
| < 9th Grade | 5.0% | 6.0% | 4.0% |
| 9-12th Grade | 6.0% | 6.0% | 6.0% |
| High School / GED | 27.0% | 28.0% | 26.0% |
| Some College | 25.0% | 19.0% | 20.0% |
| Associate's Degree | 11.0% | 10.0% | 9.0% |
| Bachelor's Degree | 16.0% | 20.0% | 21.0% |
| Master's Degree | 7.0% | 8.0% | 10.0% |
| Professional Degree | 2.0% | 2.0% | 2.0% |
| Doctorate Degree | 1.0% | 1.0% | 2.0% |
Household Income For Panama City, Florida
6.5% of households in Panama City earn Less than $10,000.
4.5% of households in Panama City earn $10,000 to $14,999.
10.3% of households in Panama City earn $15,000 to $24,999.
7.5% of households in Panama City earn $25,000 to $34,999.
15.0% of households in Panama City earn $35,000 to $49,999.
20.8% of households in Panama City earn $50,000 to $74,999.
13.0% of households in Panama City earn $75,000 to $99,999.
12.8% of households in Panama City earn $100,000 to $149,999.
4.1% of households in Panama City earn $150,000 to $199,999.
5.4% of households in Panama City earn $200,000 or more.
| Income | Panama City | FL | USA |
|---|---|---|---|
| Less than $10,000 | 6.5% | 5.2% | 4.9% |
| $10,000 to $14,999 | 4.5% | 3.7% | 3.8% |
| $15,000 to $24,999 | 10.3% | 7.6% | 7.0% |
| $25,000 to $34,999 | 7.5% | 8.3% | 7.4% |
| $35,000 to $49,999 | 15.0% | 12.1% | 10.7% |
| $50,000 to $74,999 | 20.8% | 17.6% | 16.1% |
| $75,000 to $99,999 | 13.0% | 13.2% | 12.8% |
| $100,000 to $149,999 | 12.8% | 16.0% | 17.1% |
| $150,000 to $199,999 | 4.1% | 7.4% | 8.8% |
| $200,000 or more | 5.4% | 9.0% | 11.4% |


