Tarpon Springs, FL
Demographics And Statistics
Living In Tarpon Springs, Florida Summary
Life in Tarpon Springs research summary. HomeSnacks has been using Saturday Night Science to research the quality of life in Tarpon Springs over the past nine years using Census, FBI, Zillow, and other primary data sources. Based on the most recently available data, we found the following about life in Tarpon Springs:
The population in Tarpon Springs is 25,355.
The median home value in Tarpon Springs is $424,180.
The median income in Tarpon Springs is $63,836.
The cost of living in Tarpon Springs is 95 which is 0.9x lower than the national average.
The median rent in Tarpon Springs is $1,060.
The unemployment rate in Tarpon Springs is 5.5%.
The poverty rate in Tarpon Springs is 10.6%.
The average high in Tarpon Springs is 81.0° and the average low is 64.3°.
Tarpon Springs SnackAbility
Overall SnackAbility
Tarpon Springs, FL Crime Report
Crime in Tarpon Springs summary. We use data from the FBI to determine the crime rates in Tarpon Springs. Key points include:
There were 457 total crimes in Tarpon Springs in the last reporting year.
The overall crime rate per 100,000 people in Tarpon Springs is 1,770.1 / 100k people.
The violent crime rate per 100,000 people in Tarpon Springs is 422.2 / 100k people.
The property crime rate per 100,000 people in Tarpon Springs is 1,347.9 / 100k people.
Overall, crime in Tarpon Springs is -23.84% below the national average.
Total Crimes
Below National Average
Crime In Tarpon Springs Comparison Table
| Statistic | Count Raw |
Tarpon Springs / 100k People |
Florida / 100k People |
National / 100k People |
|---|---|---|---|---|
| Total Crimes Per 100K | 457 | 1,770.1 | 2,153.0 | 2,324.2 |
| Violent Crime | 109 | 422.2 | 383.6 | 369.8 |
| Murder | 0 | 0.0 | 5.9 | 6.3 |
| Robbery | 13 | 50.4 | 62.2 | 66.1 |
| Aggravated Assault | 73 | 282.7 | 280.1 | 268.2 |
| Property Crime | 348 | 1,347.9 | 1,769.4 | 1,954.4 |
| Burglary | 34 | 131.7 | 240.6 | 269.8 |
| Larceny | 282 | 1,092.3 | 1,352.7 | 1,401.9 |
| Car Theft | 32 | 123.9 | 176.1 | 282.7 |
Tarpon Springs, FL Cost Of Living
Cost of living in Tarpon Springs summary. We use data on the cost of living to determine how expensive it is to live in Tarpon Springs. Real estate prices drive most of the variance in cost of living around Florida. Key points include:
The cost of living in Tarpon Springs is 95 with 100 being average.
The cost of living in Tarpon Springs is 0.9x lower than the national average.
The median home value in Tarpon Springs is $424,180.
The median income in Tarpon Springs is $63,836.
Tarpon Springs's Overall Cost Of Living
Lower Than The National Average
Cost Of Living In Tarpon Springs Comparison Table
| Living Expense | Tarpon Springs | Florida | National Average | |
|---|---|---|---|---|
| Overall | 95 | 101 | 100 | |
| Services | 100 | 98 | 100 | |
| Groceries | 109 | 101 | 100 | |
| Health | 91 | 96 | 100 | |
| Housing | 88 | 108 | 100 | |
| Transportation | 101 | 98 | 100 | |
| Utilities | 96 | 100 | 100 | |
Tarpon Springs, FL Weather
The average high in Tarpon Springs is 81.0° and the average low is 64.3°.
There are 71.0 days of precipitation each year.
Expect an average of 52.9 inches of precipitation each year with 0.0 inches of snow.
| Stat | Tarpon Springs |
|---|---|
| Average Annual High | 81.0 |
| Average Annual Low | 64.3 |
| Annual Precipitation Days | 71.0 |
| Average Annual Precipitation | 52.9 |
| Average Annual Snowfall | 0.0 |
Average High
Days of Rain
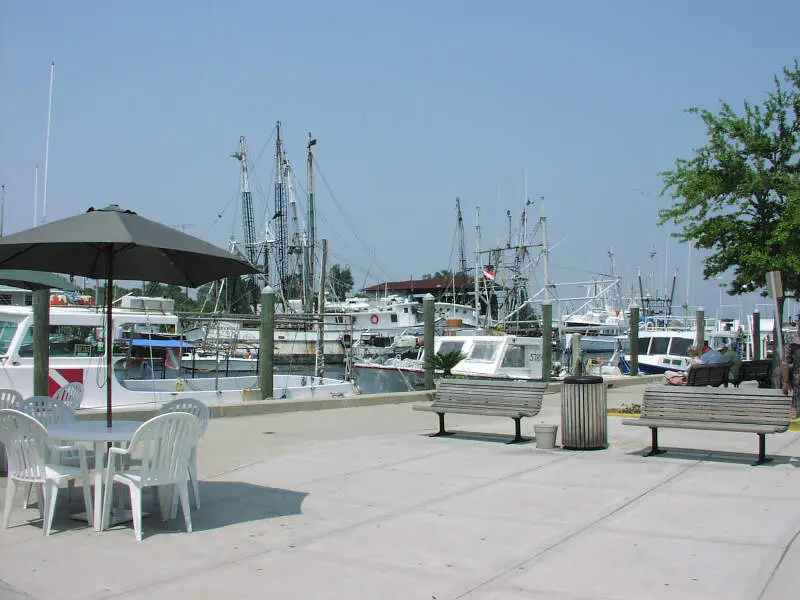
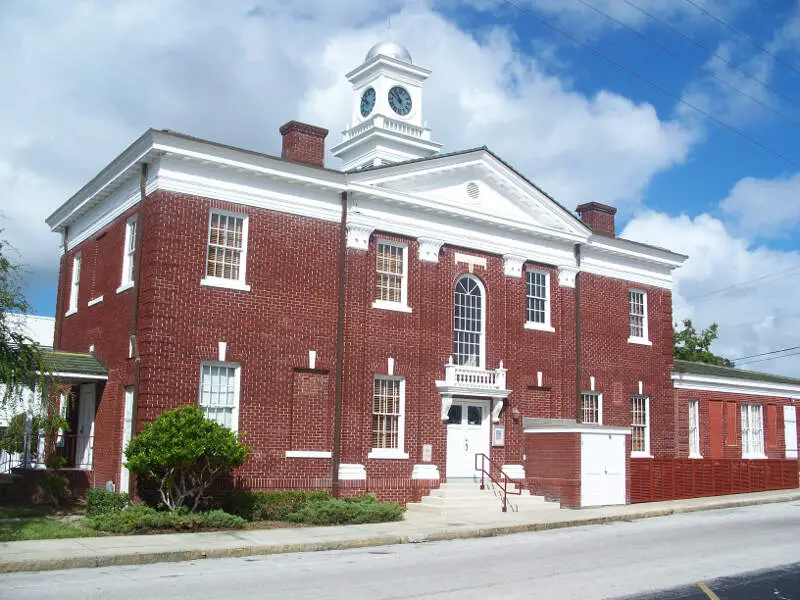
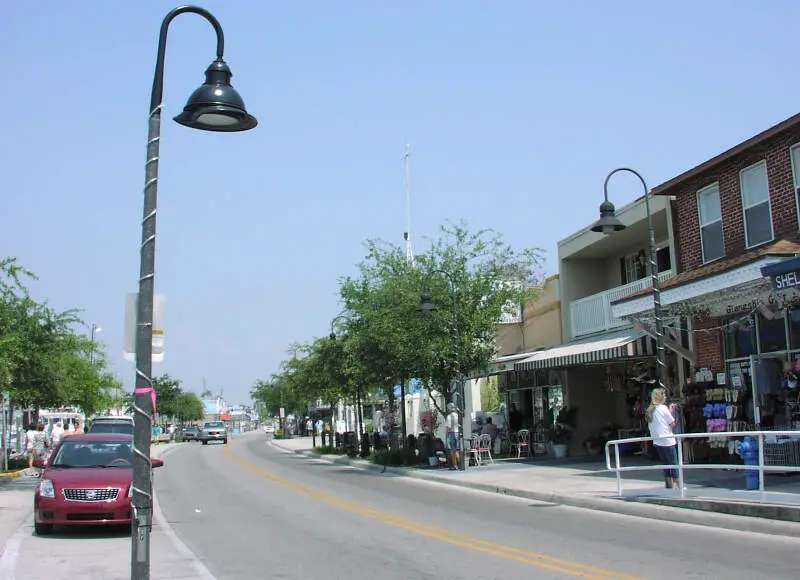
Tarpon Springs, FL Photos


Rankings for Tarpon Springs in Florida


Locations Around Tarpon Springs
Map Of Tarpon Springs, FL
Best Places Around Tarpon Springs
Safety Harbor, FL
Population 17,087
Carrollwood, FL
Population 36,148
Palm Harbor, FL
Population 61,589
Northdale, FL
Population 26,079
Trinity, FL
Population 18,672
Citrus Park, FL
Population 27,260
Largo, FL
Population 82,541
Keystone, FL
Population 26,059
Oldsmar, FL
Population 14,877
Westchase, FL
Population 24,891
Tarpon Springs Demographics And Statistics
Population over time in Tarpon Springs
The current population in Tarpon Springs is 25,355. The population has increased 9.9% from 2010.
| Year | Population | % Change |
|---|---|---|
| 2022 | 25,355 | 1.5% |
| 2021 | 24,974 | 1.2% |
| 2020 | 24,686 | 1.8% |
| 2019 | 24,244 | 1.0% |
| 2018 | 24,003 | 0.9% |
| 2017 | 23,789 | 1.0% |
| 2016 | 23,564 | 0.8% |
| 2015 | 23,382 | 0.7% |
| 2014 | 23,226 | 0.7% |
| 2013 | 23,071 | - |
Race / Ethnicity in Tarpon Springs
Tarpon Springs is:
78.5% White with 19,915 White residents.
6.3% African American with 1,592 African American residents.
0.0% American Indian with 0 American Indian residents.
0.4% Asian with 110 Asian residents.
0.1% Hawaiian with 21 Hawaiian residents.
0.4% Other with 106 Other residents.
2.7% Two Or More with 675 Two Or More residents.
11.6% Hispanic with 2,936 Hispanic residents.
| Race | Tarpon Springs | FL | USA |
|---|---|---|---|
| White | 78.5% | 52.0% | 58.9% |
| African American | 6.3% | 14.9% | 12.1% |
| American Indian | 0.0% | 0.1% | 0.6% |
| Asian | 0.4% | 2.8% | 5.7% |
| Hawaiian | 0.1% | 0.1% | 0.2% |
| Other | 0.4% | 0.5% | 0.4% |
| Two Or More | 2.7% | 3.1% | 3.5% |
| Hispanic | 11.6% | 26.5% | 18.7% |
Gender in Tarpon Springs
Tarpon Springs is 52.5% female with 13,313 female residents.
Tarpon Springs is 47.5% male with 12,042 male residents.
| Gender | Tarpon Springs | FL | USA |
|---|---|---|---|
| Female | 52.5% | 50.8% | 50.4% |
| Male | 47.5% | 49.2% | 49.6% |
Highest level of educational attainment in Tarpon Springs for adults over 25
2.0% of adults in Tarpon Springs completed < 9th grade.
5.0% of adults in Tarpon Springs completed 9-12th grade.
30.0% of adults in Tarpon Springs completed high school / ged.
20.0% of adults in Tarpon Springs completed some college.
10.0% of adults in Tarpon Springs completed associate's degree.
22.0% of adults in Tarpon Springs completed bachelor's degree.
8.0% of adults in Tarpon Springs completed master's degree.
2.0% of adults in Tarpon Springs completed professional degree.
1.0% of adults in Tarpon Springs completed doctorate degree.
| Education | Tarpon Springs | FL | USA |
|---|---|---|---|
| < 9th Grade | 2.0% | 6.0% | 4.0% |
| 9-12th Grade | 5.0% | 6.0% | 6.0% |
| High School / GED | 30.0% | 28.0% | 26.0% |
| Some College | 20.0% | 19.0% | 20.0% |
| Associate's Degree | 10.0% | 10.0% | 9.0% |
| Bachelor's Degree | 22.0% | 20.0% | 21.0% |
| Master's Degree | 8.0% | 8.0% | 10.0% |
| Professional Degree | 2.0% | 2.0% | 2.0% |
| Doctorate Degree | 1.0% | 1.0% | 2.0% |
Household Income For Tarpon Springs, Florida
5.4% of households in Tarpon Springs earn Less than $10,000.
6.7% of households in Tarpon Springs earn $10,000 to $14,999.
8.0% of households in Tarpon Springs earn $15,000 to $24,999.
8.1% of households in Tarpon Springs earn $25,000 to $34,999.
12.0% of households in Tarpon Springs earn $35,000 to $49,999.
15.2% of households in Tarpon Springs earn $50,000 to $74,999.
12.5% of households in Tarpon Springs earn $75,000 to $99,999.
15.6% of households in Tarpon Springs earn $100,000 to $149,999.
5.2% of households in Tarpon Springs earn $150,000 to $199,999.
11.2% of households in Tarpon Springs earn $200,000 or more.
| Income | Tarpon Springs | FL | USA |
|---|---|---|---|
| Less than $10,000 | 5.4% | 5.2% | 4.9% |
| $10,000 to $14,999 | 6.7% | 3.7% | 3.8% |
| $15,000 to $24,999 | 8.0% | 7.6% | 7.0% |
| $25,000 to $34,999 | 8.1% | 8.3% | 7.4% |
| $35,000 to $49,999 | 12.0% | 12.1% | 10.7% |
| $50,000 to $74,999 | 15.2% | 17.6% | 16.1% |
| $75,000 to $99,999 | 12.5% | 13.2% | 12.8% |
| $100,000 to $149,999 | 15.6% | 16.0% | 17.1% |
| $150,000 to $199,999 | 5.2% | 7.4% | 8.8% |
| $200,000 or more | 11.2% | 9.0% | 11.4% |


