Dahlonega, GA
Demographics And Statistics
Living In Dahlonega, Georgia Summary
Life in Dahlonega research summary. HomeSnacks has been using Saturday Night Science to research the quality of life in Dahlonega over the past nine years using Census, FBI, Zillow, and other primary data sources. Based on the most recently available data, we found the following about life in Dahlonega:
The population in Dahlonega is 7,083.
The median home value in Dahlonega is $344,023.
The median income in Dahlonega is $57,941.
The cost of living in Dahlonega is 119 which is 1.2x higher than the national average.
The median rent in Dahlonega is $1,181.
The unemployment rate in Dahlonega is 4.4%.
The poverty rate in Dahlonega is 29.5%.
The average high in Dahlonega is 69.4° and the average low is 47.1°.
Table Of Contents
Dahlonega SnackAbility
Overall SnackAbility
Dahlonega, GA Cost Of Living
Cost of living in Dahlonega summary. We use data on the cost of living to determine how expensive it is to live in Dahlonega. Real estate prices drive most of the variance in cost of living around Georgia. Key points include:
The cost of living in Dahlonega is 119 with 100 being average.
The cost of living in Dahlonega is 1.2x higher than the national average.
The median home value in Dahlonega is $344,023.
The median income in Dahlonega is $57,941.
Dahlonega's Overall Cost Of Living
Higher Than The National Average
Cost Of Living In Dahlonega Comparison Table
| Living Expense | Dahlonega | Georgia | National Average | |
|---|---|---|---|---|
| Overall | 119 | 89 | 100 | |
| Services | 95 | 95 | 100 | |
| Groceries | 92 | 96 | 100 | |
| Health | 86 | 98 | 100 | |
| Housing | 181 | 76 | 100 | |
| Transportation | 79 | 90 | 100 | |
| Utilities | 98 | 86 | 100 | |
Dahlonega, GA Weather
The average high in Dahlonega is 69.4° and the average low is 47.1°.
There are 82.0 days of precipitation each year.
Expect an average of 60.6 inches of precipitation each year with 5.4 inches of snow.
| Stat | Dahlonega |
|---|---|
| Average Annual High | 69.4 |
| Average Annual Low | 47.1 |
| Annual Precipitation Days | 82.0 |
| Average Annual Precipitation | 60.6 |
| Average Annual Snowfall | 5.4 |
Average High
Days of Rain
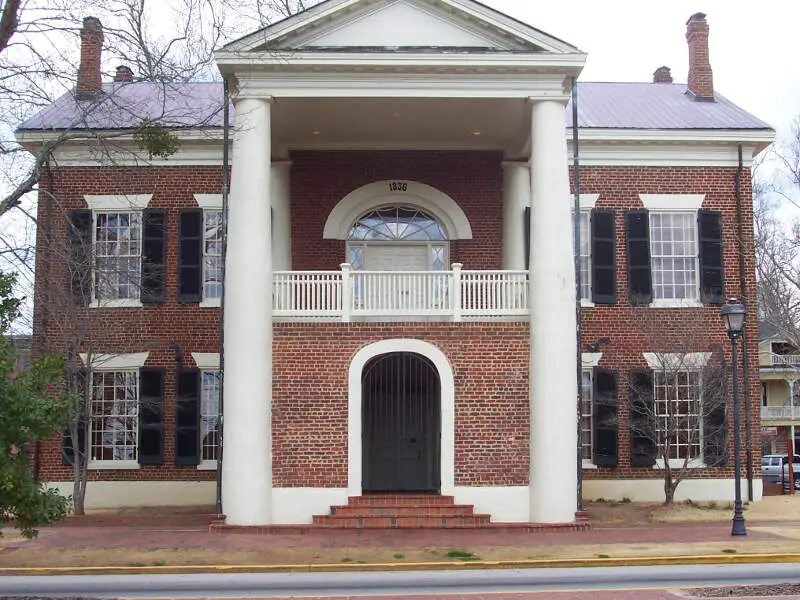
Dahlonega, GA Photos

Rankings for Dahlonega in Georgia


Locations Around Dahlonega
Map Of Dahlonega, GA
Best Places Around Dahlonega
Alpharetta, GA
Population 65,884
Roswell, GA
Population 92,770
Mountain Park, GA
Population 13,334
Mountain Park, GA
Population 13,334
Sandy Springs, GA
Population 107,221
Johns Creek, GA
Population 82,230
Suwanee, GA
Population 21,238
Woodstock, GA
Population 35,171
Duluth, GA
Population 31,742
Sugar Hill, GA
Population 24,947
Dahlonega Demographics And Statistics
Population over time in Dahlonega
The current population in Dahlonega is 7,083. The population has increased 39.9% from 2010.
| Year | Population | % Change |
|---|---|---|
| 2022 | 7,083 | 8.0% |
| 2021 | 6,556 | 2.5% |
| 2020 | 6,399 | 3.3% |
| 2019 | 6,196 | 2.4% |
| 2018 | 6,052 | 2.9% |
| 2017 | 5,884 | 3.8% |
| 2016 | 5,670 | 3.4% |
| 2015 | 5,481 | 6.3% |
| 2014 | 5,158 | 1.9% |
| 2013 | 5,062 | - |
Race / Ethnicity in Dahlonega
Dahlonega is:
86.2% White with 6,103 White residents.
4.1% African American with 291 African American residents.
0.5% American Indian with 36 American Indian residents.
0.4% Asian with 31 Asian residents.
0.0% Hawaiian with 0 Hawaiian residents.
0.0% Other with 0 Other residents.
2.5% Two Or More with 174 Two Or More residents.
6.3% Hispanic with 448 Hispanic residents.
| Race | Dahlonega | GA | USA |
|---|---|---|---|
| White | 86.2% | 50.8% | 58.9% |
| African American | 4.1% | 31.1% | 12.1% |
| American Indian | 0.5% | 0.1% | 0.6% |
| Asian | 0.4% | 4.3% | 5.7% |
| Hawaiian | 0.0% | 0.1% | 0.2% |
| Other | 0.0% | 0.5% | 0.4% |
| Two Or More | 2.5% | 3.1% | 3.5% |
| Hispanic | 6.3% | 10.1% | 18.7% |
Gender in Dahlonega
Dahlonega is 55.2% female with 3,909 female residents.
Dahlonega is 44.8% male with 3,174 male residents.
| Gender | Dahlonega | GA | USA |
|---|---|---|---|
| Female | 55.2% | 51.1% | 50.4% |
| Male | 44.8% | 48.9% | 49.6% |
Highest level of educational attainment in Dahlonega for adults over 25
0.0% of adults in Dahlonega completed < 9th grade.
3.0% of adults in Dahlonega completed 9-12th grade.
22.0% of adults in Dahlonega completed high school / ged.
16.0% of adults in Dahlonega completed some college.
6.0% of adults in Dahlonega completed associate's degree.
30.0% of adults in Dahlonega completed bachelor's degree.
13.0% of adults in Dahlonega completed master's degree.
6.0% of adults in Dahlonega completed professional degree.
4.0% of adults in Dahlonega completed doctorate degree.
| Education | Dahlonega | GA | USA |
|---|---|---|---|
| < 9th Grade | 0.0% | 5.0% | 4.0% |
| 9-12th Grade | 3.0% | 7.0% | 6.0% |
| High School / GED | 22.0% | 27.0% | 26.0% |
| Some College | 16.0% | 20.0% | 20.0% |
| Associate's Degree | 6.0% | 8.0% | 9.0% |
| Bachelor's Degree | 30.0% | 20.0% | 21.0% |
| Master's Degree | 13.0% | 9.0% | 10.0% |
| Professional Degree | 6.0% | 2.0% | 2.0% |
| Doctorate Degree | 4.0% | 2.0% | 2.0% |
Household Income For Dahlonega, Georgia
4.8% of households in Dahlonega earn Less than $10,000.
11.4% of households in Dahlonega earn $10,000 to $14,999.
15.6% of households in Dahlonega earn $15,000 to $24,999.
5.9% of households in Dahlonega earn $25,000 to $34,999.
9.9% of households in Dahlonega earn $35,000 to $49,999.
13.7% of households in Dahlonega earn $50,000 to $74,999.
4.7% of households in Dahlonega earn $75,000 to $99,999.
13.6% of households in Dahlonega earn $100,000 to $149,999.
13.9% of households in Dahlonega earn $150,000 to $199,999.
6.6% of households in Dahlonega earn $200,000 or more.
| Income | Dahlonega | GA | USA |
|---|---|---|---|
| Less than $10,000 | 4.8% | 5.4% | 4.9% |
| $10,000 to $14,999 | 11.4% | 3.8% | 3.8% |
| $15,000 to $24,999 | 15.6% | 7.5% | 7.0% |
| $25,000 to $34,999 | 5.9% | 7.9% | 7.4% |
| $35,000 to $49,999 | 9.9% | 11.2% | 10.7% |
| $50,000 to $74,999 | 13.7% | 16.6% | 16.1% |
| $75,000 to $99,999 | 4.7% | 13.1% | 12.8% |
| $100,000 to $149,999 | 13.6% | 16.6% | 17.1% |
| $150,000 to $199,999 | 13.9% | 8.1% | 8.8% |
| $200,000 or more | 6.6% | 10.0% | 11.4% |


