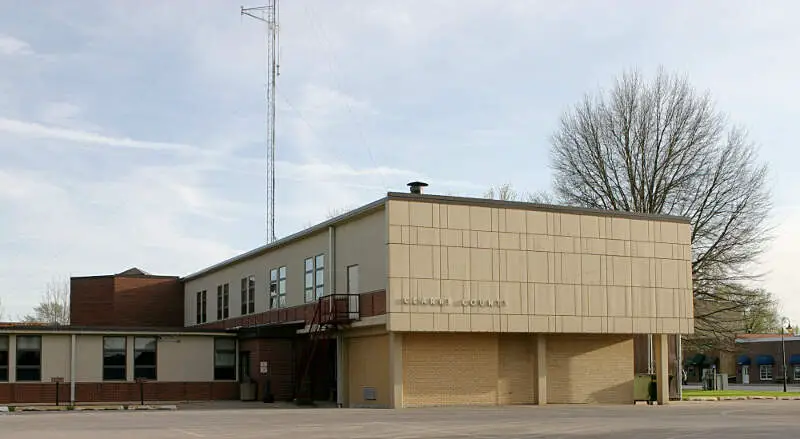
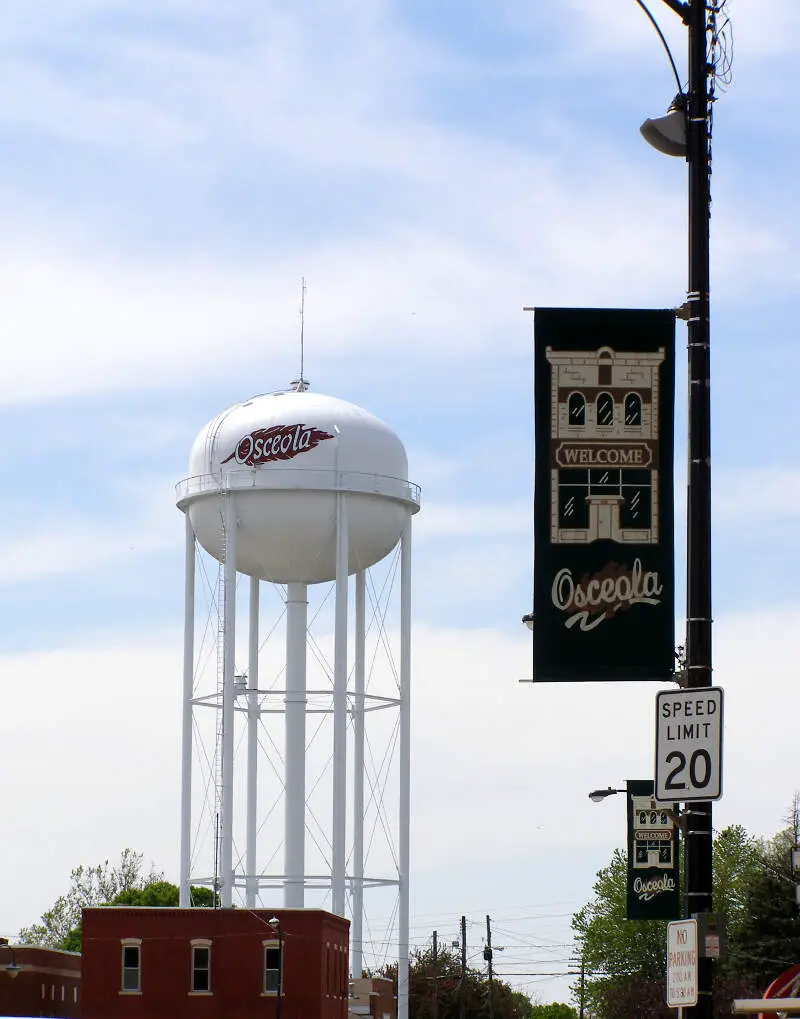
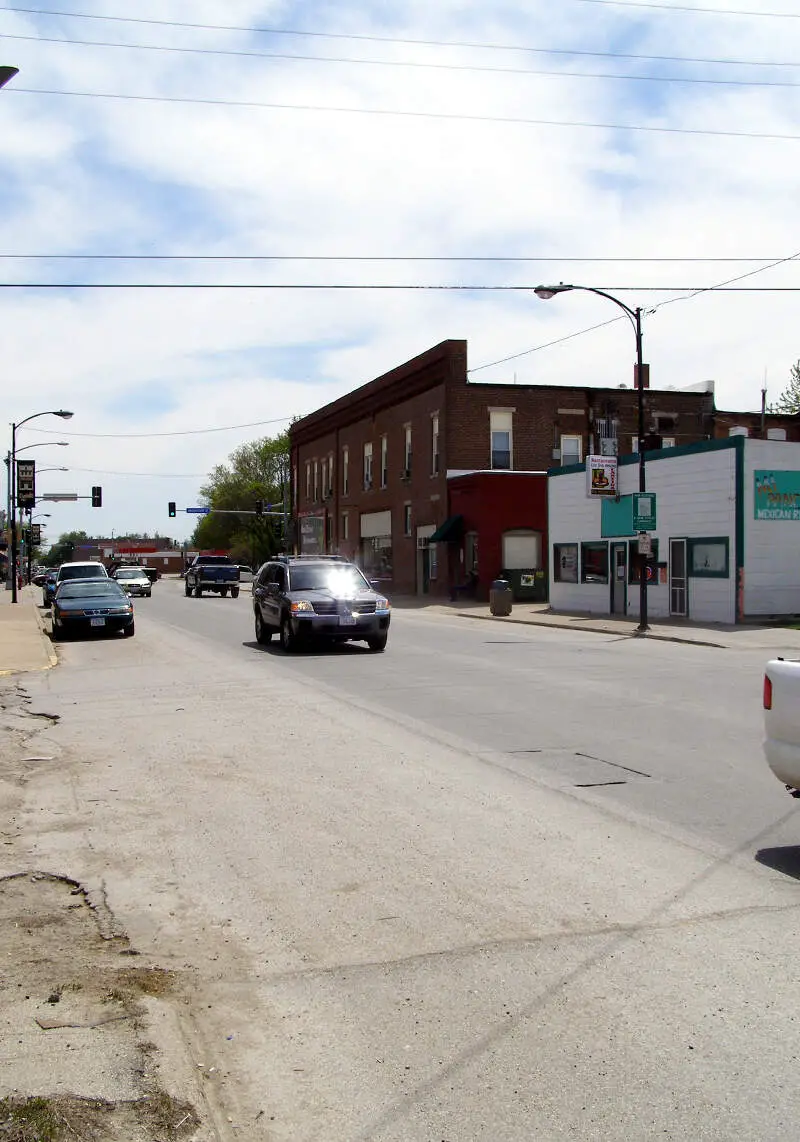
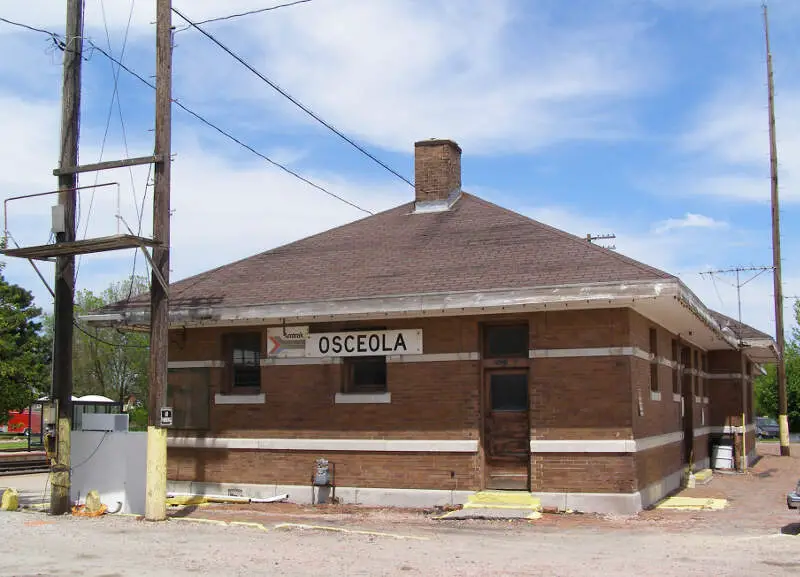
Osceola, IA
Demographics And Statistics
Living In Osceola, Iowa Summary
Life in Osceola research summary. HomeSnacks has been using Saturday Night Science to research the quality of life in Osceola over the past nine years using Census, FBI, Zillow, and other primary data sources. Based on the most recently available data, we found the following about life in Osceola:
The population in Osceola is 5,455.
The median home value in Osceola is $163,656.
The median income in Osceola is $55,208.
The cost of living in Osceola is 79 which is 0.8x lower than the national average.
The median rent in Osceola is $630.
The unemployment rate in Osceola is 5.8%.
The poverty rate in Osceola is 19.8%.
The average high in Osceola is 60.5° and the average low is 39.4°.
Osceola SnackAbility
Overall SnackAbility
Osceola, IA Crime Report
Crime in Osceola summary. We use data from the FBI to determine the crime rates in Osceola. Key points include:
There were 104 total crimes in Osceola in the last reporting year.
The overall crime rate per 100,000 people in Osceola is 1,839.4 / 100k people.
The violent crime rate per 100,000 people in Osceola is 442.2 / 100k people.
The property crime rate per 100,000 people in Osceola is 1,397.2 / 100k people.
Overall, crime in Osceola is -20.86% below the national average.
Total Crimes
Below National Average
Crime In Osceola Comparison Table
| Statistic | Count Raw |
Osceola / 100k People |
Iowa / 100k People |
National / 100k People |
|---|---|---|---|---|
| Total Crimes Per 100K | 104 | 1,839.4 | 2,001.7 | 2,324.2 |
| Violent Crime | 25 | 442.2 | 303.5 | 369.8 |
| Murder | 0 | 0.0 | 3.5 | 6.3 |
| Robbery | 1 | 17.7 | 29.8 | 66.1 |
| Aggravated Assault | 20 | 353.7 | 229.4 | 268.2 |
| Property Crime | 79 | 1,397.2 | 1,698.2 | 1,954.4 |
| Burglary | 16 | 283.0 | 371.1 | 269.8 |
| Larceny | 56 | 990.4 | 1,130.1 | 1,401.9 |
| Car Theft | 7 | 123.8 | 197.1 | 282.7 |
Osceola, IA Cost Of Living
Cost of living in Osceola summary. We use data on the cost of living to determine how expensive it is to live in Osceola. Real estate prices drive most of the variance in cost of living around Iowa. Key points include:
The cost of living in Osceola is 79 with 100 being average.
The cost of living in Osceola is 0.8x lower than the national average.
The median home value in Osceola is $163,656.
The median income in Osceola is $55,208.
Osceola's Overall Cost Of Living
Lower Than The National Average
Cost Of Living In Osceola Comparison Table
| Living Expense | Osceola | Iowa | National Average | |
|---|---|---|---|---|
| Overall | 79 | 89 | 100 | |
| Services | 94 | 95 | 100 | |
| Groceries | 98 | 98 | 100 | |
| Health | 94 | 99 | 100 | |
| Housing | 53 | 73 | 100 | |
| Transportation | 87 | 98 | 100 | |
| Utilities | 86 | 94 | 100 | |
Osceola, IA Weather
The average high in Osceola is 60.5° and the average low is 39.4°.
There are 64.4 days of precipitation each year.
Expect an average of 36.8 inches of precipitation each year with 26.4 inches of snow.
| Stat | Osceola |
|---|---|
| Average Annual High | 60.5 |
| Average Annual Low | 39.4 |
| Annual Precipitation Days | 64.4 |
| Average Annual Precipitation | 36.8 |
| Average Annual Snowfall | 26.4 |
Average High
Days of Rain
Osceola, IA Photos
Rankings for Osceola in Iowa


Locations Around Osceola
Map Of Osceola, IA
Best Places Around Osceola
Urbandale, IA
Population 45,591
Ankeny, IA
Population 68,392
Clive, IA
Population 18,576
West Des Moines, IA
Population 68,744
Johnston, IA
Population 23,856
Norwalk, IA
Population 13,057
Altoona, IA
Population 20,017
Waukee, IA
Population 25,045
Grimes, IA
Population 15,402
Pleasant Hill, IA
Population 10,456
Osceola Demographics And Statistics
Population over time in Osceola
The current population in Osceola is 5,455. The population has increased 11.8% from 2010.
| Year | Population | % Change |
|---|---|---|
| 2022 | 5,455 | 8.6% |
| 2021 | 5,021 | 0.5% |
| 2020 | 4,998 | 0.1% |
| 2019 | 4,992 | 0.1% |
| 2018 | 4,985 | 0.1% |
| 2017 | 4,981 | -0.0% |
| 2016 | 4,983 | 0.7% |
| 2015 | 4,948 | 0.9% |
| 2014 | 4,905 | 0.6% |
| 2013 | 4,878 | - |
Race / Ethnicity in Osceola
Osceola is:
66.7% White with 3,636 White residents.
0.0% African American with 2 African American residents.
0.3% American Indian with 16 American Indian residents.
0.7% Asian with 38 Asian residents.
0.0% Hawaiian with 0 Hawaiian residents.
0.0% Other with 0 Other residents.
5.9% Two Or More with 320 Two Or More residents.
26.5% Hispanic with 1,443 Hispanic residents.
| Race | Osceola | IA | USA |
|---|---|---|---|
| White | 66.7% | 83.8% | 58.9% |
| African American | 0.0% | 3.7% | 12.1% |
| American Indian | 0.3% | 0.2% | 0.6% |
| Asian | 0.7% | 2.5% | 5.7% |
| Hawaiian | 0.0% | 0.1% | 0.2% |
| Other | 0.0% | 0.2% | 0.4% |
| Two Or More | 5.9% | 2.9% | 3.5% |
| Hispanic | 26.5% | 6.5% | 18.7% |
Gender in Osceola
Osceola is 48.7% female with 2,654 female residents.
Osceola is 51.3% male with 2,800 male residents.
| Gender | Osceola | IA | USA |
|---|---|---|---|
| Female | 48.7% | 49.9% | 50.4% |
| Male | 51.3% | 50.1% | 49.6% |
Highest level of educational attainment in Osceola for adults over 25
5.0% of adults in Osceola completed < 9th grade.
15.0% of adults in Osceola completed 9-12th grade.
44.0% of adults in Osceola completed high school / ged.
19.0% of adults in Osceola completed some college.
5.0% of adults in Osceola completed associate's degree.
7.0% of adults in Osceola completed bachelor's degree.
4.0% of adults in Osceola completed master's degree.
1.0% of adults in Osceola completed professional degree.
0.0% of adults in Osceola completed doctorate degree.
| Education | Osceola | IA | USA |
|---|---|---|---|
| < 9th Grade | 5.0% | 3.0% | 4.0% |
| 9-12th Grade | 15.0% | 4.0% | 6.0% |
| High School / GED | 44.0% | 31.0% | 26.0% |
| Some College | 19.0% | 20.0% | 20.0% |
| Associate's Degree | 5.0% | 12.0% | 9.0% |
| Bachelor's Degree | 7.0% | 20.0% | 21.0% |
| Master's Degree | 4.0% | 7.0% | 10.0% |
| Professional Degree | 1.0% | 2.0% | 2.0% |
| Doctorate Degree | 0.0% | 1.0% | 2.0% |
Household Income For Osceola, Iowa
13.6% of households in Osceola earn Less than $10,000.
6.2% of households in Osceola earn $10,000 to $14,999.
5.6% of households in Osceola earn $15,000 to $24,999.
4.7% of households in Osceola earn $25,000 to $34,999.
18.5% of households in Osceola earn $35,000 to $49,999.
19.3% of households in Osceola earn $50,000 to $74,999.
6.5% of households in Osceola earn $75,000 to $99,999.
19.1% of households in Osceola earn $100,000 to $149,999.
2.4% of households in Osceola earn $150,000 to $199,999.
4.1% of households in Osceola earn $200,000 or more.
| Income | Osceola | IA | USA |
|---|---|---|---|
| Less than $10,000 | 13.6% | 4.2% | 4.9% |
| $10,000 to $14,999 | 6.2% | 3.6% | 3.8% |
| $15,000 to $24,999 | 5.6% | 7.4% | 7.0% |
| $25,000 to $34,999 | 4.7% | 7.8% | 7.4% |
| $35,000 to $49,999 | 18.5% | 11.9% | 10.7% |
| $50,000 to $74,999 | 19.3% | 17.9% | 16.1% |
| $75,000 to $99,999 | 6.5% | 14.3% | 12.8% |
| $100,000 to $149,999 | 19.1% | 18.2% | 17.1% |
| $150,000 to $199,999 | 2.4% | 7.6% | 8.8% |
| $200,000 or more | 4.1% | 7.1% | 11.4% |


