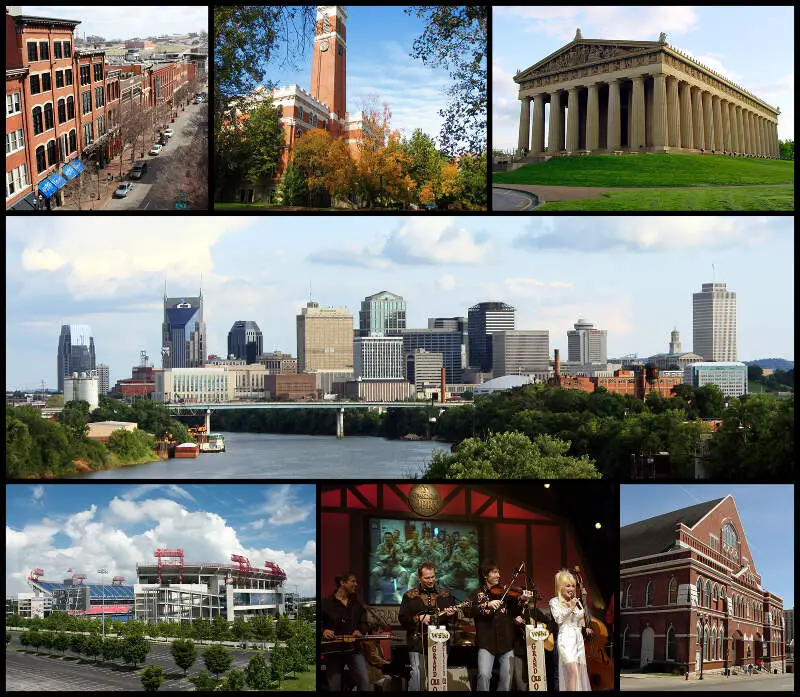
Nashville, TN
Demographics And Statistics
Living In Nashville, Tennessee Summary
Life in Nashville research summary. HomeSnacks has been using Saturday Night Science to research the quality of life in Nashville over the past nine years using Census, FBI, Zillow, and other primary data sources. Based on the most recently available data, we found the following about life in Nashville:
The population in Nashville is 684,103.
The median home value in Nashville is $428,714.
The median income in Nashville is $71,328.
The cost of living in Nashville is 94 which is 0.9x lower than the national average.
The median rent in Nashville is $1,392.
The unemployment rate in Nashville is 4.6%.
The poverty rate in Nashville is 14.5%.
The average high in Nashville is 69.7° and the average low is 46.8°.
Table Of Contents
Nashville SnackAbility
Overall SnackAbility
Nashville, TN Cost Of Living
Cost of living in Nashville summary. We use data on the cost of living to determine how expensive it is to live in Nashville. Real estate prices drive most of the variance in cost of living around Tennessee. Key points include:
The cost of living in Nashville is 94 with 100 being average.
The cost of living in Nashville is 0.9x lower than the national average.
The median home value in Nashville is $428,714.
The median income in Nashville is $71,328.
Nashville's Overall Cost Of Living
Lower Than The National Average
Cost Of Living In Nashville Comparison Table
| Living Expense | Nashville | Tennessee | National Average | |
|---|---|---|---|---|
| Overall | 94 | 90 | 100 | |
| Services | 95 | 93 | 100 | |
| Groceries | 96 | 96 | 100 | |
| Health | 89 | 88 | 100 | |
| Housing | 97 | 82 | 100 | |
| Transportation | 92 | 90 | 100 | |
| Utilities | 90 | 93 | 100 | |
Nashville, TN Weather
The average high in Nashville is 69.7° and the average low is 46.8°.
There are 78.3 days of precipitation each year.
Expect an average of 50.1 inches of precipitation each year with 3.9 inches of snow.
| Stat | Nashville |
|---|---|
| Average Annual High | 69.7 |
| Average Annual Low | 46.8 |
| Annual Precipitation Days | 78.3 |
| Average Annual Precipitation | 50.1 |
| Average Annual Snowfall | 3.9 |
Average High
Days of Rain
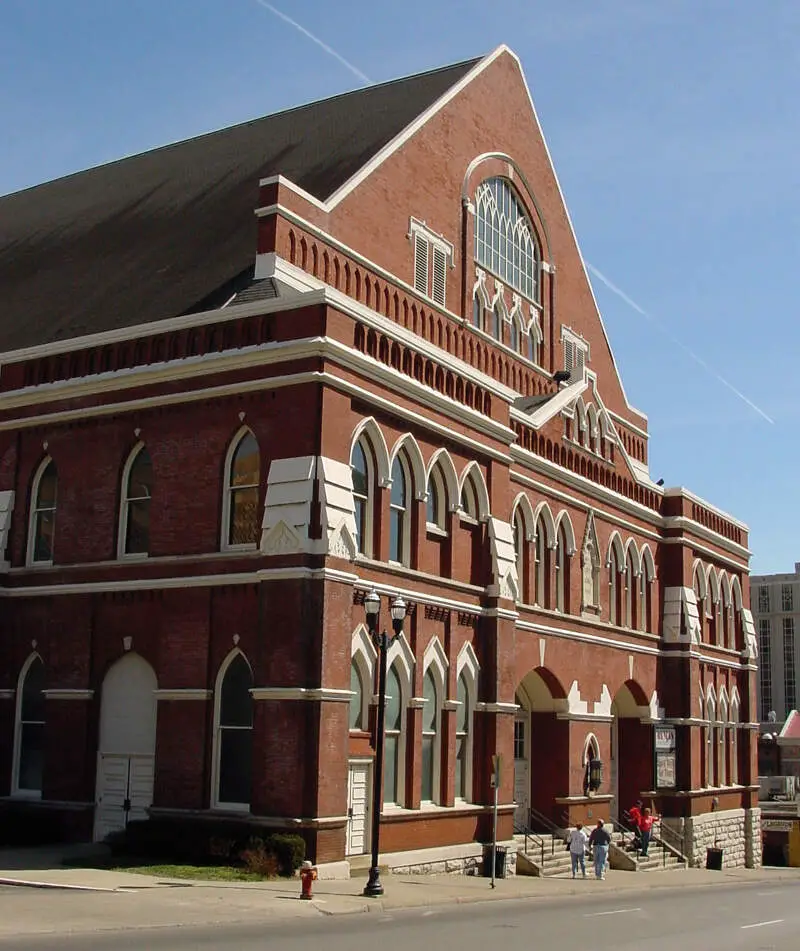
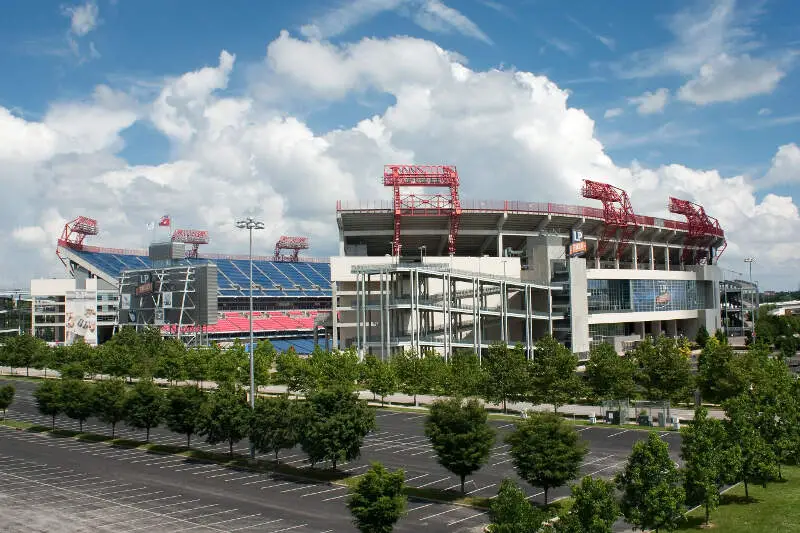
Nashville, TN Photos


8 Reviews & Comments About Nashville
/5

Killer Batman -
Hey, Tennessee is beautiful. Also the laundry thing is the internet's fault.!, I live in Nashville but I love it here! One good thing about Memphis is the history and bbq.
Ray Burton -
I live in Nashville! It's nice but expensive! Memphis is cutthroat!
Coochiemain_69 -
I live in Nashville, HOLY S**T THE 91st California license plate today!
HomeSnacks User - 2018-08-03 01:18:38.674248
Great food. Lots to do on Broadway. Will travel here from Pennsylvania once a year to vacation. Love the country music, bars, and surrounding areas.
Broadway Brewhouse for their delicious wings, bushwackers, and trout dip.
HomeSnacks User - 2018-08-05 13:49:07.157058
I have traveled to Nashville many times and love it. The weather is great and there are lots of activities to take advantage of. There are many great restaurants.
The bars on Broadway are lots of fun - with great music. You can enjoy delicious food also.
HomeSnacks User - 2018-08-20 18:22:32.980439
I visited Nashville to see a friend and it was a great experience! People are very nice and the weather was wonderful. It has a great nightlife and food scenery.
What stood out was the food scene. The southern comfort food was to die for and the Nashville Hot Chicken lives up to its hype. I would visit again if I could.
HomeSnacks User - 2018-08-27 22:13:29.242709
I love Nashville. Housing market is excellent, jobs aplenty, and crime rate low. The scenery is beautiful, restaurant food excellent and musicians cannot be surpassed. In addition, schools are excellent for my grandchildren who live in the area.
I love Opryland, the beautiful hotel and shows. General Jackson showboat is very fun. I do not like the traffic which is horrible.
HomeSnacks User - 2018-08-28 01:11:51.871729
There was a lot to do. I went with my young son and was able to find a lot of fun, family-friendly activities.
We really enjoyed the zoo and the science center.I liked taking my son to an art museum that had an entire floor for kids to create their own art projects.
Nashville Articles

Rankings for Nashville in Tennessee


Locations Around Nashville
Map Of Nashville, TN
Best Places Around Nashville
Nashville Demographics And Statistics
Population over time in Nashville
The current population in Nashville is 684,103. The population has increased 16.4% from 2010.
| Year | Population | % Change |
|---|---|---|
| 2022 | 684,103 | 3.6% |
| 2021 | 660,062 | 0.9% |
| 2020 | 654,187 | 1.6% |
| 2019 | 643,771 | 1.5% |
| 2018 | 634,512 | 1.6% |
| 2017 | 624,261 | 1.5% |
| 2016 | 614,908 | 1.5% |
| 2015 | 605,859 | 1.8% |
| 2014 | 595,132 | 1.2% |
| 2013 | 587,790 | - |
Race / Ethnicity in Nashville
Nashville is:
54.9% White with 375,668 White residents.
26.5% African American with 181,355 African American residents.
0.1% American Indian with 477 American Indian residents.
3.6% Asian with 24,748 Asian residents.
0.1% Hawaiian with 358 Hawaiian residents.
0.5% Other with 3,194 Other residents.
3.6% Two Or More with 24,703 Two Or More residents.
10.8% Hispanic with 73,600 Hispanic residents.
| Race | Nashville | TN | USA |
|---|---|---|---|
| White | 54.9% | 72.6% | 58.9% |
| African American | 26.5% | 16.1% | 12.1% |
| American Indian | 0.1% | 0.1% | 0.6% |
| Asian | 3.6% | 1.8% | 5.7% |
| Hawaiian | 0.1% | 0.0% | 0.2% |
| Other | 0.5% | 0.3% | 0.4% |
| Two Or More | 3.6% | 3.0% | 3.5% |
| Hispanic | 10.8% | 6.0% | 18.7% |
Gender in Nashville
Nashville is 51.5% female with 352,350 female residents.
Nashville is 48.5% male with 331,753 male residents.
| Gender | Nashville | TN | USA |
|---|---|---|---|
| Female | 51.5% | 50.9% | 50.4% |
| Male | 48.5% | 49.1% | 49.6% |
Highest level of educational attainment in Nashville for adults over 25
4.0% of adults in Nashville completed < 9th grade.
6.0% of adults in Nashville completed 9-12th grade.
21.0% of adults in Nashville completed high school / ged.
18.0% of adults in Nashville completed some college.
6.0% of adults in Nashville completed associate's degree.
28.0% of adults in Nashville completed bachelor's degree.
11.0% of adults in Nashville completed master's degree.
3.0% of adults in Nashville completed professional degree.
3.0% of adults in Nashville completed doctorate degree.
| Education | Nashville | TN | USA |
|---|---|---|---|
| < 9th Grade | 4.0% | 4.0% | 4.0% |
| 9-12th Grade | 6.0% | 7.0% | 6.0% |
| High School / GED | 21.0% | 31.0% | 26.0% |
| Some College | 18.0% | 20.0% | 20.0% |
| Associate's Degree | 6.0% | 8.0% | 9.0% |
| Bachelor's Degree | 28.0% | 19.0% | 21.0% |
| Master's Degree | 11.0% | 8.0% | 10.0% |
| Professional Degree | 3.0% | 2.0% | 2.0% |
| Doctorate Degree | 3.0% | 1.0% | 2.0% |
Household Income For Nashville, Tennessee
5.4% of households in Nashville earn Less than $10,000.
3.2% of households in Nashville earn $10,000 to $14,999.
6.4% of households in Nashville earn $15,000 to $24,999.
7.1% of households in Nashville earn $25,000 to $34,999.
12.3% of households in Nashville earn $35,000 to $49,999.
18.0% of households in Nashville earn $50,000 to $74,999.
13.4% of households in Nashville earn $75,000 to $99,999.
16.3% of households in Nashville earn $100,000 to $149,999.
7.7% of households in Nashville earn $150,000 to $199,999.
10.3% of households in Nashville earn $200,000 or more.
| Income | Nashville | TN | USA |
|---|---|---|---|
| Less than $10,000 | 5.4% | 5.3% | 4.9% |
| $10,000 to $14,999 | 3.2% | 4.5% | 3.8% |
| $15,000 to $24,999 | 6.4% | 8.4% | 7.0% |
| $25,000 to $34,999 | 7.1% | 8.5% | 7.4% |
| $35,000 to $49,999 | 12.3% | 12.8% | 10.7% |
| $50,000 to $74,999 | 18.0% | 17.6% | 16.1% |
| $75,000 to $99,999 | 13.4% | 13.2% | 12.8% |
| $100,000 to $149,999 | 16.3% | 15.7% | 17.1% |
| $150,000 to $199,999 | 7.7% | 6.7% | 8.8% |
| $200,000 or more | 10.3% | 7.3% | 11.4% |


