Barrington Hills, IL
Quality of Life, Demographics, And Statistics
Living In Barrington Hills, Illinois Summary
Life in Barrington Hills research summary. HomeSnacks has been researching the quality of life in Barrington Hills over the past eight years using Census data, FBI crime data, cost of living data, and other primary sources. Based on the most recently available data, we found the following about life in Barrington Hills:
The population in Barrington Hills is 4,236.
The median home value in Barrington Hills is $735,800.
The median income in Barrington Hills is $185,446.
The median rent in Barrington Hills is $2,697.
The unemployment rate in Barrington Hills is 3.3%.
The poverty rate in Barrington Hills is 6.8%.
Table Of Contents
Barrington Hills SnackAbility
9.5
Overall SnackAbility
Overall SnackAbility
Jobs
9/10
Housing
10
Affordability
5
Diversity
6
Safety
9
Amenities
5
Education
10
Commute
2
Barrington Hills, IL Photos
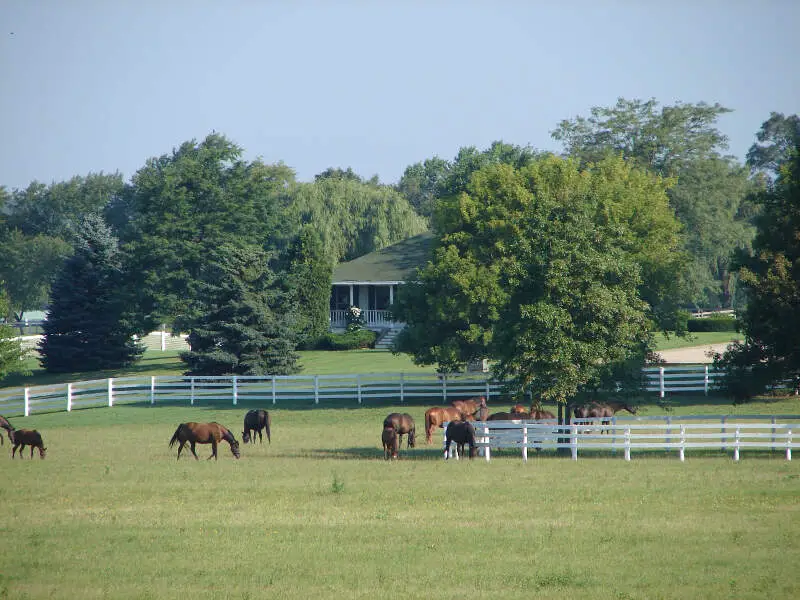
Source: Public Domain
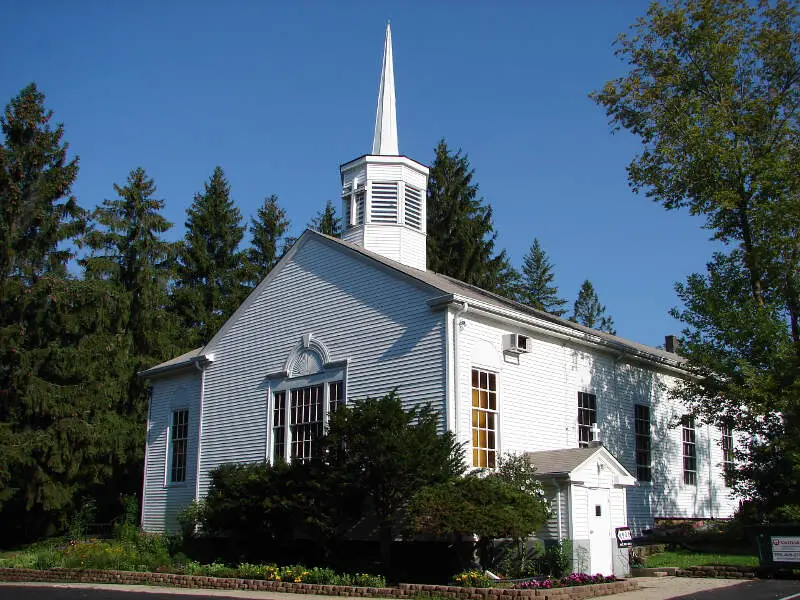
Source: Public Domain
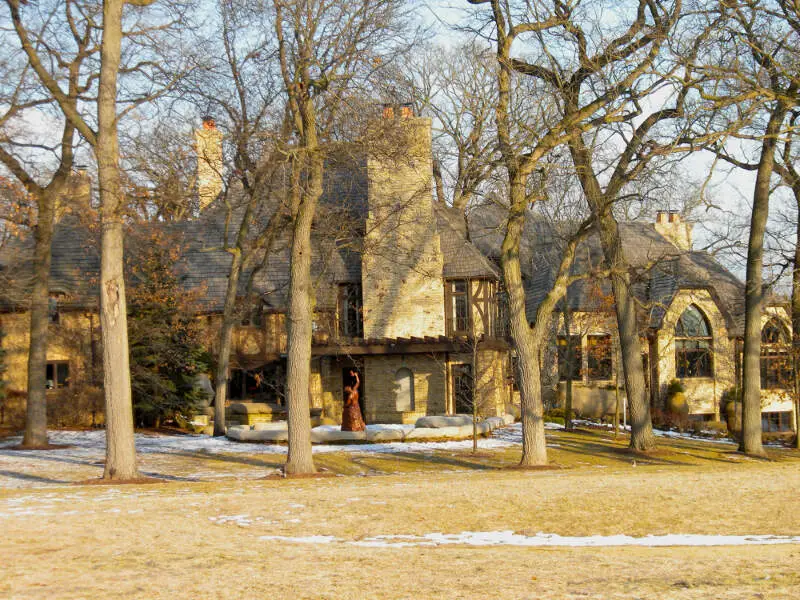
Source: Public Domain
Rankings for Barrington Hills in Illinois


Map Of Barrington Hills, IL
Best Places Around Barrington Hills
1
Buffalo Grove, IL
Population 43,062
2
Deerfield, IL
Population 19,228
3
Northbrook, IL
Population 35,108
4
Glenview, IL
Population 48,150
5
Winfield, IL
Population 9,852
6
Lake Zurich, IL
Population 19,807
7
Arlington Heights, IL
Population 77,283
8
Bartlett, IL
Population 41,126
9
Hawthorn Woods, IL
Population 8,959
10
Vernon Hills, IL
Population 26,723
Population over time in Barrington Hills
| Year | Population | % Change |
|---|---|---|
| 2021 | 4,236 | 8.2% |
| 2020 | 3,916 | 8.1% |
| 2019 | 3,622 | 1.3% |
| 2018 | 3,574 | 6.1% |
| 2017 | 3,370 | -7.7% |
| 2016 | 3,653 | 0.0% |
| 2015 | 3,653 | -7.2% |
| 2014 | 3,938 | 2.4% |
| 2013 | 3,847 | -7.6% |
| 2012 | 4,165 | - |
Race / Ethnicity in Barrington Hills
| Race | Barrington Hills | IL | USA |
|---|---|---|---|
| White | 88.4% | 60.2% | 59.4% |
| African American | 0.7% | 13.8% | 12.2% |
| American Indian | 0.0% | 0.1% | 0.6% |
| Asian | 9.8% | 5.6% | 5.6% |
| Hawaiian | 0.0% | 0.0% | 0.2% |
| Other | 0.0% | 0.3% | 0.4% |
| Two Or More | 0.3% | 2.4% | 3.2% |
| Hispanic | 0.8% | 17.5% | 18.4% |
Gender in Barrington Hills
| Gender | Barrington Hills | IL | USA |
|---|---|---|---|
| Female | 52.5% | 50.6% | 50.5% |
| Male | 47.5% | 49.4% | 49.5% |
Highest level of educational attainment in Barrington Hills for adults over 25
| Education | Barrington Hills | IL | USA |
|---|---|---|---|
| < 9th Grade | 1.0% | 6.0% | 5.0% |
| 9-12th Grade | 2.0% | 6.0% | 6.0% |
| High School / GED | 6.0% | 25.0% | 26.0% |
| Some College | 13.0% | 20.0% | 20.0% |
| Associate's Degree | 7.0% | 8.0% | 9.0% |
| Bachelor's Degree | 42.0% | 22.0% | 21.0% |
| Master's Degree | 13.0% | 10.0% | 9.0% |
| Professional Degree | 12.0% | 2.0% | 2.0% |
| Doctorate Degree | 4.0% | 1.0% | 2.0% |
Household Income For Barrington Hills, Illinois
| Income | Barrington Hills | IL | USA |
|---|---|---|---|
| Less than $10,000 | 0.8% | 5.9% | 5.5% |
| $10,000 to $14,999 | 4.3% | 3.5% | 3.9% |
| $15,000 to $24,999 | 0.0% | 7.4% | 7.8% |
| $25,000 to $34,999 | 0.5% | 7.7% | 8.2% |
| $35,000 to $49,999 | 4.9% | 10.7% | 11.4% |
| $50,000 to $74,999 | 10.2% | 16.3% | 16.8% |
| $75,000 to $99,999 | 6.1% | 12.9% | 12.8% |
| $100,000 to $149,999 | 15.6% | 17.1% | 16.3% |
| $150,000 to $199,999 | 9.4% | 8.5% | 7.8% |
| $200,000 or more | 48.1% | 10.1% | 9.5% |


