Cook County Summary

Life in Cook County research summary. HomeSnacks has been researching the quality of life in Cook County over the past eight years using Census data, FBI crime data, cost of living data, and other primary sources. Based on the most recently available data, we found the following about life in Cook County:

  • The population in Cook County is 5,225,367.

  • The median home value in Cook County is $290,211.

  • The median income in Cook County is $78,304.

  • The median rent in Cook County is $1,318.

  • The unemployment rate in Cook County is 7.1%.

  • The poverty rate in Cook County is 13.4%.

  • The average high in Cook County is 63.0° and there are 90.4 inches of rainfall annually.

Cities & Towns in Cook County

List Of Cities & Towns in Cook County

Chicago, IL Population 2,721,914

Elgin, IL Population 114,190

Cicero, IL Population 84,189

Schaumburg, IL Population 77,571

Evanston, IL Population 77,181

Arlington Heights, IL Population 76,794

Palatine, IL Population 67,223

Skokie, IL Population 67,076

Des Plaines, IL Population 60,087

Orland Park, IL Population 58,345

Oak Lawn, IL Population 57,665

Berwyn, IL Population 56,556

Mount Prospect, IL Population 56,191

Tinley Park, IL Population 55,571

Oak Park, IL Population 53,834

Hoffman Estates, IL Population 51,744

Glenview, IL Population 47,896

Elmhurst, IL Population 45,648

Buffalo Grove, IL Population 42,934

Bartlett, IL Population 40,829

Streamwood, IL Population 39,556

Park Ridge, IL Population 39,368

Wheeling, IL Population 38,823

Hanover Park, IL Population 37,222

Calumet City, IL Population 35,708

Northbrook, IL Population 34,950

Woodridge, IL Population 34,027

Elk Grove Village, IL Population 32,498

Niles, IL Population 30,637

Burbank, IL Population 29,122

Lansing, IL Population 28,713

Wilmette, IL Population 27,801

Chicago Heights, IL Population 27,366

Oak Forest, IL Population 27,199

Melrose Park, IL Population 25,177

Morton Grove, IL Population 24,910

Homer Glen, IL Population 24,507

Elmwood Park, IL Population 24,281

Rolling Meadows, IL Population 24,054

Maywood, IL Population 23,385

Blue Island, IL Population 22,934

Roselle, IL Population 22,846

South Holland, IL Population 21,287

Dolton, IL Population 21,283

Park Forest, IL Population 21,042

Frankfort, IL Population 20,260

Harvey, IL Population 20,035

Homewood, IL Population 19,868

Evergreen Park, IL Population 19,730

Brookfield, IL Population 19,349

Deerfield, IL Population 19,173

Matteson, IL Population 18,898

Alsip, IL Population 18,866

Bensenville, IL Population 18,673

Bellwood, IL Population 18,611

Franklin Park, IL Population 18,374

Palos Hills, IL Population 18,278

Lemont, IL Population 17,558

Hinsdale, IL Population 17,169

Bridgeview, IL Population 16,939

Westchester, IL Population 16,694

Country Club Hills, IL Population 16,578

La Grange, IL Population 16,128

Prospect Heights, IL Population 15,861

Norridge, IL Population 15,291

Hickory Hills, IL Population 14,915

Chicago Ridge, IL Population 14,284

Midlothian, IL Population 14,200

Forest Park, IL Population 14,165

Hazel Crest, IL Population 13,737

Western Springs, IL Population 13,557

La Grange Park, IL Population 13,332

Lincolnwood, IL Population 13,268

Richton Park, IL Population 12,721

Northlake, IL Population 12,683

Winnetka, IL Population 12,607

Justice, IL Population 12,525

Palos Heights, IL Population 11,965

Schiller Park, IL Population 11,600

Markham, IL Population 11,592

River Forest, IL Population 11,568

Barrington, IL Population 11,244

Burr Ridge, IL Population 11,131

Summit, IL Population 11,036

Worth, IL Population 10,859

Crestwood, IL Population 10,737

Lyons, IL Population 10,687

River Grove, IL Population 10,532

Riverdale, IL Population 10,528

Sauk Village, IL Population 9,862

Steger, IL Population 9,518

Flossmoor, IL Population 9,405

Riverside, IL Population 9,225

Lynwood, IL Population 9,087

Harwood Heights, IL Population 8,942

Glencoe, IL Population 8,787

Glenwood, IL Population 8,542

Crete, IL Population 8,425

Hillside, IL Population 8,213

Oak Brook, IL Population 8,065

Broadview, IL Population 7,957

Inverness, IL Population 7,722

University Park, IL Population 7,328

North Riverside, IL Population 7,245

Calumet Park, IL Population 7,193

Stickney, IL Population 7,031

Orland Hills, IL Population 6,842

Countryside, IL Population 6,322

Willow Springs, IL Population 5,862

Northfield, IL Population 5,707

Posen, IL Population 5,442

Berkeley, IL Population 5,283

South Barrington, IL Population 5,001

Olympia Fields, IL Population 4,922

Palos Park, IL Population 4,836

Robbins, IL Population 4,804

Stone Park, IL Population 4,566

Hometown, IL Population 4,299

Burnham, IL Population 4,028

Indian Head Park, IL Population 4,022

South Chicago Heights, IL Population 3,986

Barrington Hills, IL Population 3,890

Rosemont, IL Population 3,864

Deer Park, IL Population 3,694

East Dundee, IL Population 3,157

Dixmoor, IL Population 3,017

Kenilworth, IL Population 2,537

Thornton, IL Population 2,169

Merrionette Park, IL Population 2,014

Hodgkins, IL Population 1,714

Ford Heights, IL Population 1,618

East Hazel Crest, IL Population 1,341

Phoenix, IL Population 1,278

Forest View, IL Population 1,078

Bedford Park, IL Population 619

Golf, IL Population 546

McCook, IL Population 299

Map Of Cook County

Cook County, IL Weather

  • The average high in Cook County is 63.0°.

  • There are 74.77 nice days each year.

  • Expect an average of 90.4 inches of rain each year with 10.8 inches of snow.

  • There is an average of 4:39 hours of sun each day in Cook County.

StatCook County
Mean High63.0
Nice Days74.77
Rainfall90.4
Snowfall10.8
Sunny_hours4:39
63.0°
Average High
90.4
Inches of Rain

Cook County Photos

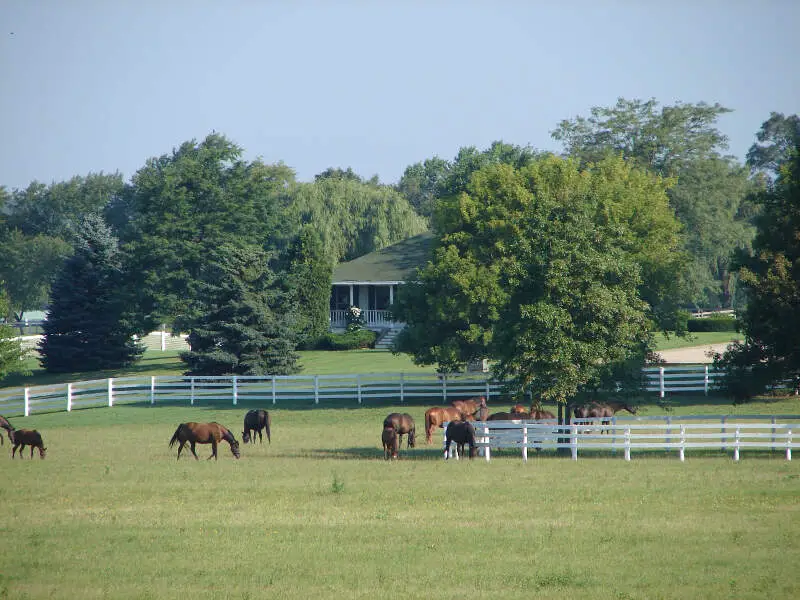
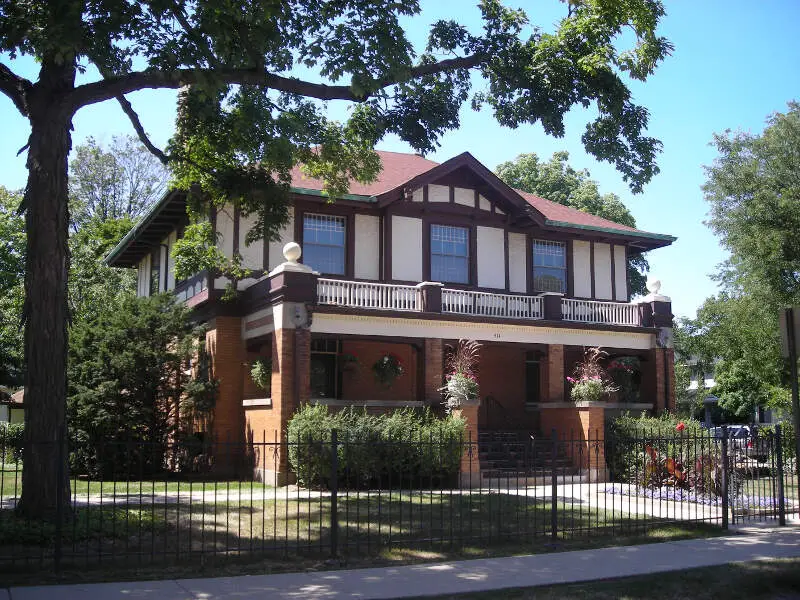
Bantac Nathaniel Moore House Arlington Heightsc Il
Source: Wikipedia User G LeTourneau | GFDL
Bhills
Source: Public Domain
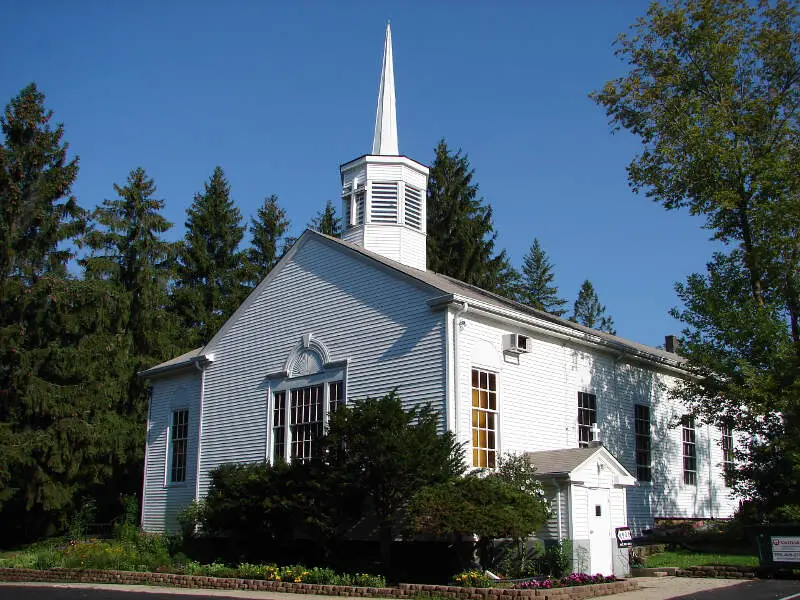
Bcenterchurch
Source: Public Domain
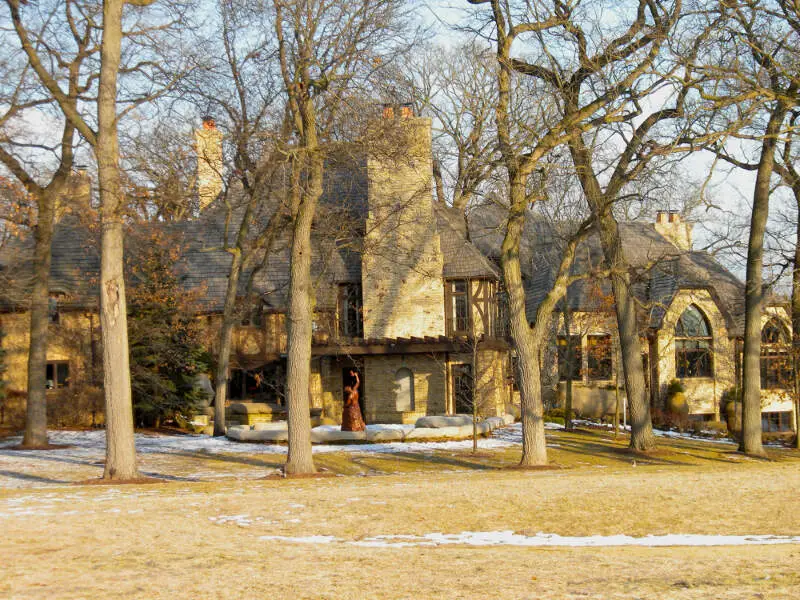
Bhills Estate
Source: Public Domain
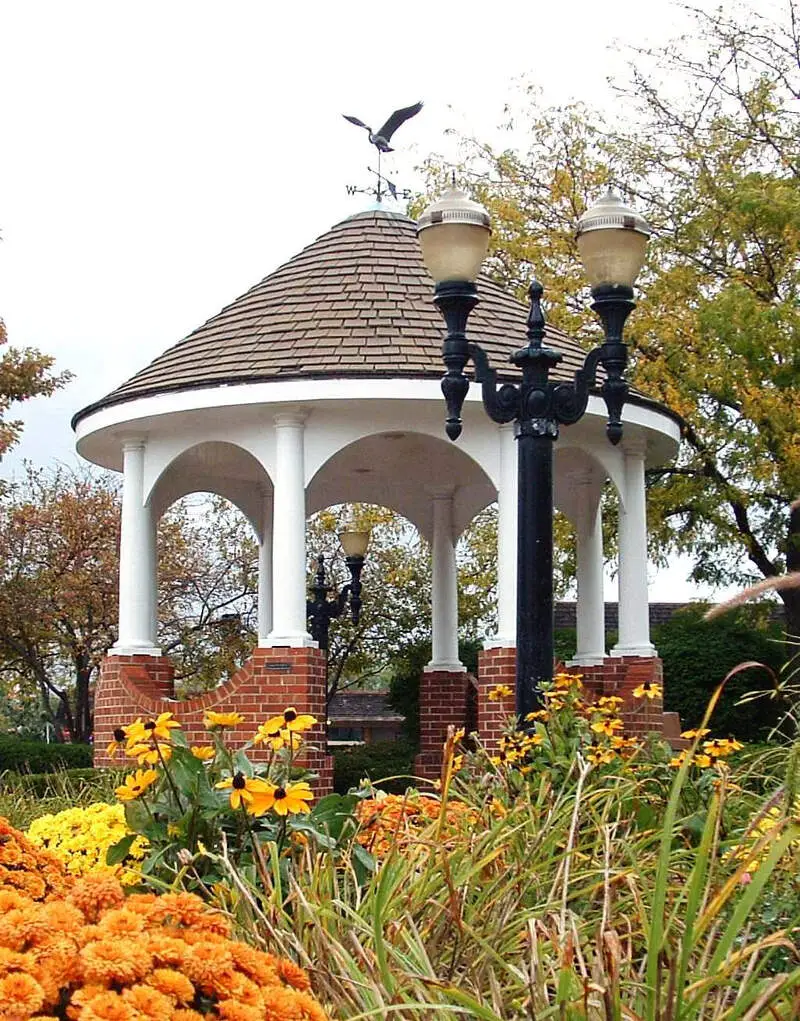
Barrington Gazebo Fall
Source: Public Domain
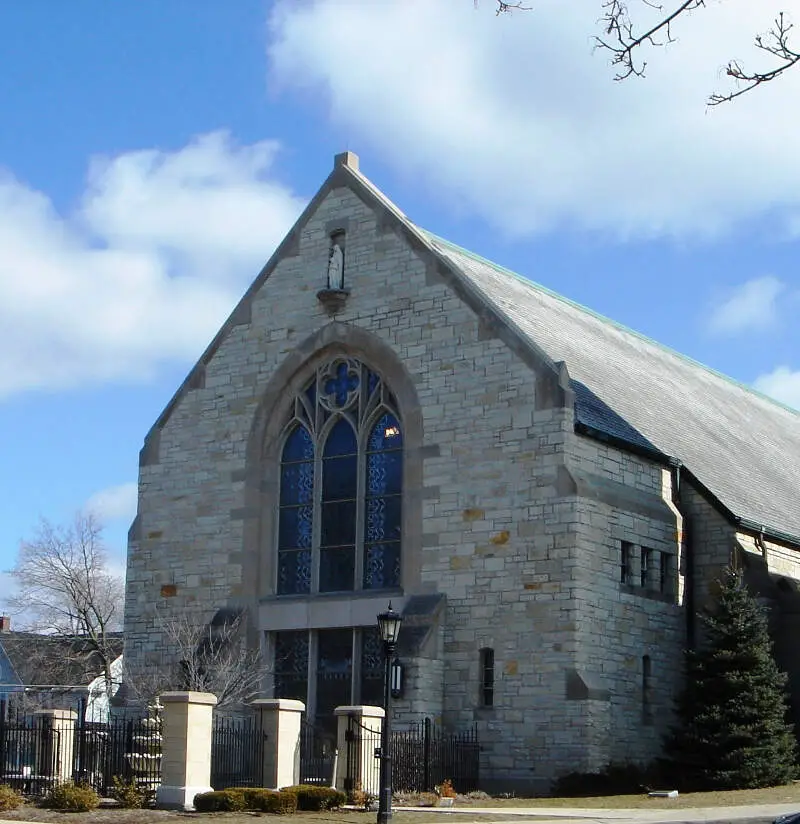
Chapel Exterior
Source: Wikipedia User | PD

Cook County Demographics

Population over time in Cook County

The current population in Cook County is 5,225,367. The population has increased 1.3% from 2019.

Year Population % Change
2022 5,265,398 1.9%
2021 5,169,517 -0.6%
2020 5,198,275 -

Gender in Cook County

  • Cook County is 51.1% female with 2,670,726 female residents.

  • Cook County is 48.9% male with 2,554,641 male residents.

Female
51.1% (2,670,726)
Male
48.9% (2,554,641)
Gender Cook County IL USA
Female 51.1% 50.5% 50.4%
Male 48.9% 49.5% 49.6%

Race / Ethnicity in Cook County

Cook County is:

  • 41.1% White with 2,148,173 White residents.

  • 22.4% African American with 1,170,790 African American residents.

  • 0.1% American Indian with 3,917 American Indian residents.

  • 7.6% Asian with 398,558 Asian residents.

  • 0.0% Hawaiian with 1,179 Hawaiian residents.

  • 0.4% Other with 19,681 Other residents.

  • 2.5% Two Or More with 130,587 Two Or More residents.

  • 25.9% Hispanic with 1,352,482 Hispanic residents.

White
41.1% (2,148,173)
African American
22.4% (1,170,790)
American Indian
0.1% (3,917)
Asian
7.6% (398,558)
Hawaiian
0.0% (1,179)
Other
0.4% (19,681)
Two Or More
2.5% (130,587)
Hispanic
25.9% (1,352,482)

Table: Cook County By Race

Race Cook County IL USA
White 41.1% 59.6% 58.9%
African American 22.4% 13.7% 12.1%
American Indian 0.1% 0.1% 0.6%
Asian 7.6% 5.7% 5.7%
Hawaiian 0.0% 0.0% 0.2%
Other 0.4% 0.3% 0.4%
Two Or More 2.5% 2.8% 3.5%
Hispanic 25.9% 17.8% 18.7%

Household Income For Cook County, Illinois

  • 6.0% of households in Cook County earn Less than $10,000.

  • 3.9% of households in Cook County earn $10,000 to $14,999.

  • 6.8% of households in Cook County earn $15,000 to $24,999.

  • 7.1% of households in Cook County earn $25,000 to $34,999.

  • 9.7% of households in Cook County earn $35,000 to $49,999.

  • 14.6% of households in Cook County earn $50,000 to $74,999.

  • 12.4% of households in Cook County earn $75,000 to $99,999.

  • 16.8% of households in Cook County earn $100,000 to $149,999.

  • 9.3% of households in Cook County earn $150,000 to $199,999.

  • 13.4% of households in Cook County earn $200,000 or more.

Less than $10,000
6.0% (314,536)
$10,000 to $14,999
3.9% (205,401)
$15,000 to $24,999
6.8% (356,291)
$25,000 to $34,999
7.1% (373,222)
$35,000 to $49,999
9.7% (506,129)
$50,000 to $74,999
14.6% (763,654)
$75,000 to $99,999
12.4% (645,758)
$100,000 to $149,999
16.8% (875,298)
$150,000 to $199,999
9.3% (483,801)
$200,000 or more
13.4% (701,273)
Income Cook County IL USA
Less than $10,000 6.0% 5.3% 4.9%
$10,000 to $14,999 3.9% 3.5% 3.8%
$15,000 to $24,999 6.8% 6.7% 7.0%
$25,000 to $34,999 7.1% 7.1% 7.4%
$35,000 to $49,999 9.7% 10.1% 10.7%
$50,000 to $74,999 14.6% 15.4% 16.1%
$75,000 to $99,999 12.4% 12.9% 12.8%
$100,000 to $149,999 16.8% 17.6% 17.1%
$150,000 to $199,999 9.3% 9.4% 8.8%
$200,000 or more 13.4% 12.1% 11.4%

Highest level of educational attainment in Cook County for adults over 25

  • 6.0% of adults in Cook County completed < 9th grade.

  • 6.0% of adults in Cook County completed 9-12th grade.

  • 22.0% of adults in Cook County completed high school / ged.

  • 18.0% of adults in Cook County completed some college.

  • 7.0% of adults in Cook County completed associate's degree.

  • 24.0% of adults in Cook County completed bachelor's degree.

  • 12.0% of adults in Cook County completed master's degree.

  • 3.0% of adults in Cook County completed professional degree.

  • 2.0% of adults in Cook County completed doctorate degree.

< 9th Grade
6% (313,522)
9-12th Grade
6% (313,522)
High School / GED
22% (1,149,580)
Some College
18% (940,566)
Associate's Degree
7% (365,775)
Bachelor's Degree
24% (1,254,088)
Master's Degree
12% (627,044)
Professional Degree
3% (156,761)
Doctorate Degree
2% (104,507)
Education Cook County IL USA
< 9th Grade 6% 6% 3%
9-12th Grade 6% 5% 6%
High School / GED 22% 25% 26%
Some College 18% 20% 20%
Associate's Degree 7% 8% 9%
Bachelor's Degree 24% 22% 21%
Master's Degree 12% 11% 10%
Professional Degree 3% 2% 2%
Doctorate Degree 2% 1% 2%

Articles About Illinois

Enjoy The Snack?

About HomeSnacks

HomeSnacks is based in Durham, NC.

We aim to deliver bite-sized pieces of infotainment about where you live.

We use data, analytics, and a sense of humor to determine quality of life for places across the nation.

© Chasing Chains, LLC. All rights reserved.