East St. Louis, IL
Demographics And Statistics
Living In East St. Louis, Illinois Summary
Life in East St. Louis research summary. HomeSnacks has been using Saturday Night Science to research the quality of life in East St. Louis over the past nine years using Census, FBI, Zillow, and other primary data sources. Based on the most recently available data, we found the following about life in East St. Louis:
The population in East St. Louis is 18,796.
The median home value in East St. Louis is $35,320.
The median income in East St. Louis is $28,519.
The cost of living in East St. Louis is 76 which is 0.8x lower than the national average.
The median rent in East St. Louis is $585.
The unemployment rate in East St. Louis is 13.1%.
The poverty rate in East St. Louis is 31.6%.
The average high in East St. Louis is 66.2° and the average low is 46.1°.
East St. Louis SnackAbility
Overall SnackAbility
East St. Louis, IL Crime Report
Crime in East St. Louis summary. We use data from the FBI to determine the crime rates in East St. Louis. Key points include:
There were 630 total crimes in East St. Louis in the last reporting year.
The overall crime rate per 100,000 people in East St. Louis is 2,397.5 / 100k people.
The violent crime rate per 100,000 people in East St. Louis is 1,065.6 / 100k people.
The property crime rate per 100,000 people in East St. Louis is 1,332.0 / 100k people.
Overall, crime in East St. Louis is 3.16% above the national average.
Total Crimes
Above National Average
Crime In East St. Louis Comparison Table
| Statistic | Count Raw |
East St. Louis / 100k People |
Illinois / 100k People |
National / 100k People |
|---|---|---|---|---|
| Total Crimes Per 100K | 630 | 2,397.5 | 1,985.3 | 2,324.2 |
| Violent Crime | 280 | 1,065.6 | 425.9 | 369.8 |
| Murder | 50 | 190.3 | 9.1 | 6.3 |
| Robbery | 31 | 118.0 | 97.4 | 66.1 |
| Aggravated Assault | 189 | 719.3 | 278.9 | 268.2 |
| Property Crime | 350 | 1,332.0 | 1,559.4 | 1,954.4 |
| Burglary | 153 | 582.3 | 246.4 | 269.8 |
| Larceny | 111 | 422.4 | 1,143.5 | 1,401.9 |
| Car Theft | 122 | 464.3 | 169.5 | 282.7 |
East St. Louis, IL Cost Of Living
Cost of living in East St. Louis summary. We use data on the cost of living to determine how expensive it is to live in East St. Louis. Real estate prices drive most of the variance in cost of living around Illinois. Key points include:
The cost of living in East St. Louis is 76 with 100 being average.
The cost of living in East St. Louis is 0.8x lower than the national average.
The median home value in East St. Louis is $35,320.
The median income in East St. Louis is $28,519.
East St. Louis's Overall Cost Of Living
Lower Than The National Average
Cost Of Living In East St. Louis Comparison Table
| Living Expense | East St. Louis | Illinois | National Average | |
|---|---|---|---|---|
| Overall | 76 | 92 | 100 | |
| Services | 89 | 95 | 100 | |
| Groceries | 95 | 98 | 100 | |
| Health | 89 | 96 | 100 | |
| Housing | 37 | 81 | 100 | |
| Transportation | 90 | 105 | 100 | |
| Utilities | 94 | 90 | 100 | |
East St. Louis, IL Weather
The average high in East St. Louis is 66.2° and the average low is 46.1°.
There are 75.4 days of precipitation each year.
Expect an average of 42.2 inches of precipitation each year with 13.6 inches of snow.
| Stat | East St. Louis |
|---|---|
| Average Annual High | 66.2 |
| Average Annual Low | 46.1 |
| Annual Precipitation Days | 75.4 |
| Average Annual Precipitation | 42.2 |
| Average Annual Snowfall | 13.6 |
Average High
Days of Rain
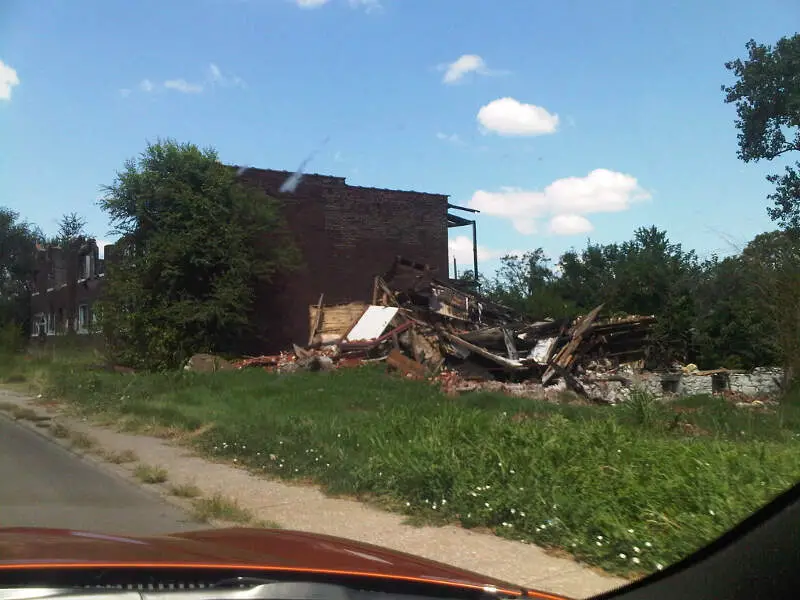
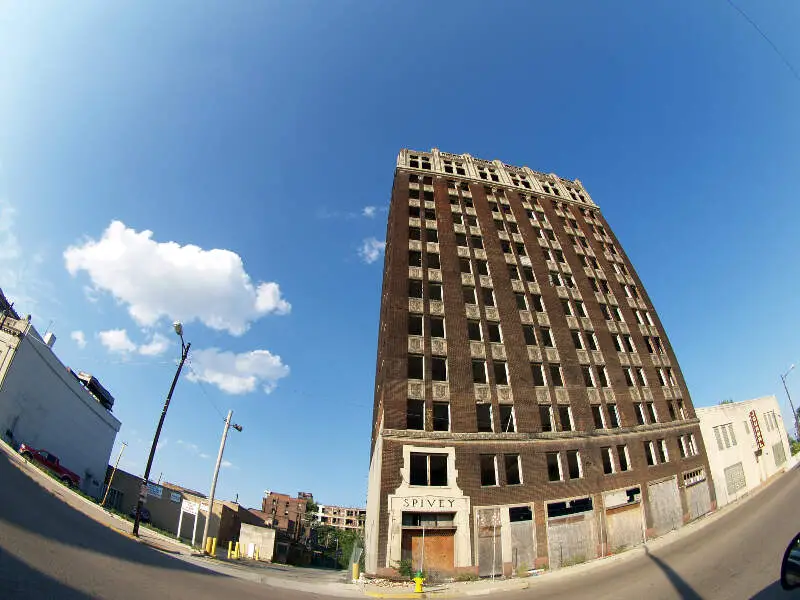
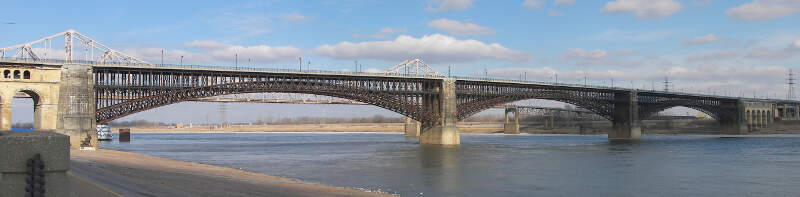
East St. Louis, IL Photos

1 Reviews & Comments About East St. Louis
/5

HomeSnacks User - 2018-07-15 03:26:40.141591
The area is very crime ridden. We went there and my friend got his car broken into while we were at a club.
The place just seemed dirty. The people were generally pretty unfriendly. Overall, not a place I would want to visit again any time soon
Rankings for East St. Louis in Illinois


Locations Around East St. Louis
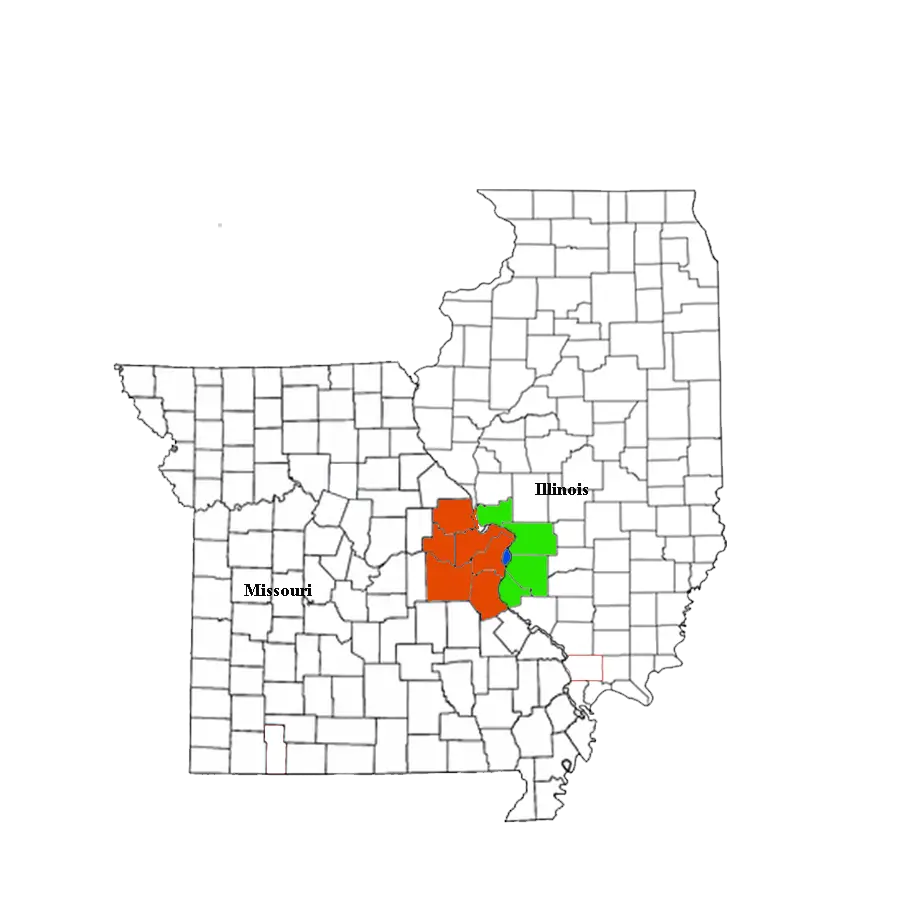
Map Of East St. Louis, IL
Best Places Around East St. Louis
O'Fallon, IL
Population 32,104
Waterloo, IL
Population 11,012
Maryville, IL
Population 8,219
Troy, IL
Population 10,920
Shiloh, IL
Population 13,892
Swansea, IL
Population 14,888
Columbia, IL
Population 11,036
Edwardsville, IL
Population 26,622
Mascoutah, IL
Population 8,762
Glen Carbon, IL
Population 13,654
East St. Louis Demographics And Statistics
Population over time in East St. Louis
The current population in East St. Louis is 18,796. The population has decreased -32.3% from 2010.
| Year | Population | % Change |
|---|---|---|
| 2022 | 18,796 | -29.5% |
| 2021 | 26,647 | -0.1% |
| 2020 | 26,678 | -0.2% |
| 2019 | 26,731 | 0.2% |
| 2018 | 26,689 | -0.0% |
| 2017 | 26,697 | -0.5% |
| 2016 | 26,830 | -1.1% |
| 2015 | 27,116 | -1.2% |
| 2014 | 27,432 | -1.1% |
| 2013 | 27,750 | - |
Race / Ethnicity in East St. Louis
East St. Louis is:
1.8% White with 341 White residents.
93.4% African American with 17,559 African American residents.
0.0% American Indian with 2 American Indian residents.
1.0% Asian with 184 Asian residents.
0.0% Hawaiian with 0 Hawaiian residents.
0.7% Other with 138 Other residents.
1.8% Two Or More with 338 Two Or More residents.
1.2% Hispanic with 234 Hispanic residents.
| Race | East St. Louis | IL | USA |
|---|---|---|---|
| White | 1.8% | 59.6% | 58.9% |
| African American | 93.4% | 13.7% | 12.1% |
| American Indian | 0.0% | 0.1% | 0.6% |
| Asian | 1.0% | 5.7% | 5.7% |
| Hawaiian | 0.0% | 0.0% | 0.2% |
| Other | 0.7% | 0.3% | 0.4% |
| Two Or More | 1.8% | 2.8% | 3.5% |
| Hispanic | 1.2% | 17.8% | 18.7% |
Gender in East St. Louis
East St. Louis is 56.5% female with 10,617 female residents.
East St. Louis is 43.5% male with 8,179 male residents.
| Gender | East St. Louis | IL | USA |
|---|---|---|---|
| Female | 56.5% | 50.5% | 50.4% |
| Male | 43.5% | 49.5% | 49.6% |
Highest level of educational attainment in East St. Louis for adults over 25
5.0% of adults in East St. Louis completed < 9th grade.
13.0% of adults in East St. Louis completed 9-12th grade.
38.0% of adults in East St. Louis completed high school / ged.
25.0% of adults in East St. Louis completed some college.
7.0% of adults in East St. Louis completed associate's degree.
7.0% of adults in East St. Louis completed bachelor's degree.
4.0% of adults in East St. Louis completed master's degree.
1.0% of adults in East St. Louis completed professional degree.
0.0% of adults in East St. Louis completed doctorate degree.
| Education | East St. Louis | IL | USA |
|---|---|---|---|
| < 9th Grade | 5.0% | 6.0% | 4.0% |
| 9-12th Grade | 13.0% | 5.0% | 6.0% |
| High School / GED | 38.0% | 25.0% | 26.0% |
| Some College | 25.0% | 20.0% | 20.0% |
| Associate's Degree | 7.0% | 8.0% | 9.0% |
| Bachelor's Degree | 7.0% | 22.0% | 21.0% |
| Master's Degree | 4.0% | 11.0% | 10.0% |
| Professional Degree | 1.0% | 2.0% | 2.0% |
| Doctorate Degree | 0.0% | 1.0% | 2.0% |
Household Income For East St. Louis, Illinois
17.0% of households in East St. Louis earn Less than $10,000.
10.3% of households in East St. Louis earn $10,000 to $14,999.
17.6% of households in East St. Louis earn $15,000 to $24,999.
11.5% of households in East St. Louis earn $25,000 to $34,999.
12.3% of households in East St. Louis earn $35,000 to $49,999.
16.2% of households in East St. Louis earn $50,000 to $74,999.
6.6% of households in East St. Louis earn $75,000 to $99,999.
5.6% of households in East St. Louis earn $100,000 to $149,999.
2.1% of households in East St. Louis earn $150,000 to $199,999.
0.9% of households in East St. Louis earn $200,000 or more.
| Income | East St. Louis | IL | USA |
|---|---|---|---|
| Less than $10,000 | 17.0% | 5.3% | 4.9% |
| $10,000 to $14,999 | 10.3% | 3.5% | 3.8% |
| $15,000 to $24,999 | 17.6% | 6.7% | 7.0% |
| $25,000 to $34,999 | 11.5% | 7.1% | 7.4% |
| $35,000 to $49,999 | 12.3% | 10.1% | 10.7% |
| $50,000 to $74,999 | 16.2% | 15.4% | 16.1% |
| $75,000 to $99,999 | 6.6% | 12.9% | 12.8% |
| $100,000 to $149,999 | 5.6% | 17.6% | 17.1% |
| $150,000 to $199,999 | 2.1% | 9.4% | 8.8% |
| $200,000 or more | 0.9% | 12.1% | 11.4% |


