Oak Park, IL
Demographics And Statistics
Living In Oak Park, Illinois Summary
Life in Oak Park research summary. HomeSnacks has been using Saturday Night Science to research the quality of life in Oak Park over the past nine years using Census, FBI, Zillow, and other primary data sources. Based on the most recently available data, we found the following about life in Oak Park:
The population in Oak Park is 53,834.
The median home value in Oak Park is $391,539.
The median income in Oak Park is $103,264.
The cost of living in Oak Park is 125 which is 1.2x higher than the national average.
The median rent in Oak Park is $1,409.
The unemployment rate in Oak Park is 4.9%.
The poverty rate in Oak Park is 6.9%.
The average high in Oak Park is 59.6° and the average low is 42.2°.
Oak Park SnackAbility
Overall SnackAbility
Oak Park, IL Crime Report
Crime in Oak Park summary. We use data from the FBI to determine the crime rates in Oak Park. Key points include:
There were 1,742 total crimes in Oak Park in the last reporting year.
The overall crime rate per 100,000 people in Oak Park is 3,340.2 / 100k people.
The violent crime rate per 100,000 people in Oak Park is 327.9 / 100k people.
The property crime rate per 100,000 people in Oak Park is 3,012.3 / 100k people.
Overall, crime in Oak Park is 43.72% above the national average.
Total Crimes
Above National Average
Crime In Oak Park Comparison Table
| Statistic | Count Raw |
Oak Park / 100k People |
Illinois / 100k People |
National / 100k People |
|---|---|---|---|---|
| Total Crimes Per 100K | 1,742 | 3,340.2 | 1,985.3 | 2,324.2 |
| Violent Crime | 171 | 327.9 | 425.9 | 369.8 |
| Murder | 3 | 5.8 | 9.1 | 6.3 |
| Robbery | 81 | 155.3 | 97.4 | 66.1 |
| Aggravated Assault | 54 | 103.5 | 278.9 | 268.2 |
| Property Crime | 1,571 | 3,012.3 | 1,559.4 | 1,954.4 |
| Burglary | 168 | 322.1 | 246.4 | 269.8 |
| Larceny | 1,145 | 2,195.5 | 1,143.5 | 1,401.9 |
| Car Theft | 258 | 494.7 | 169.5 | 282.7 |
Oak Park, IL Cost Of Living
Cost of living in Oak Park summary. We use data on the cost of living to determine how expensive it is to live in Oak Park. Real estate prices drive most of the variance in cost of living around Illinois. Key points include:
The cost of living in Oak Park is 125 with 100 being average.
The cost of living in Oak Park is 1.2x higher than the national average.
The median home value in Oak Park is $391,539.
The median income in Oak Park is $103,264.
Oak Park's Overall Cost Of Living
Higher Than The National Average
Cost Of Living In Oak Park Comparison Table
| Living Expense | Oak Park | Illinois | National Average | |
|---|---|---|---|---|
| Overall | 125 | 92 | 100 | |
| Services | 105 | 95 | 100 | |
| Groceries | 106 | 98 | 100 | |
| Health | 113 | 96 | 100 | |
| Housing | 169 | 81 | 100 | |
| Transportation | 123 | 105 | 100 | |
| Utilities | 99 | 90 | 100 | |
Oak Park, IL Weather
The average high in Oak Park is 59.6° and the average low is 42.2°.
There are 72.5 days of precipitation each year.
Expect an average of 38.9 inches of precipitation each year with 35.7 inches of snow.
| Stat | Oak Park |
|---|---|
| Average Annual High | 59.6 |
| Average Annual Low | 42.2 |
| Annual Precipitation Days | 72.5 |
| Average Annual Precipitation | 38.9 |
| Average Annual Snowfall | 35.7 |
Average High
Days of Rain
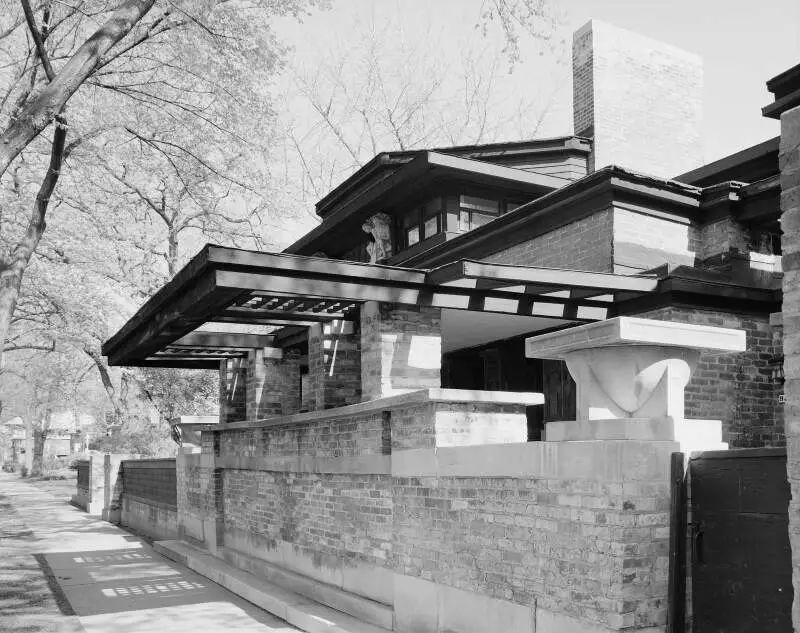
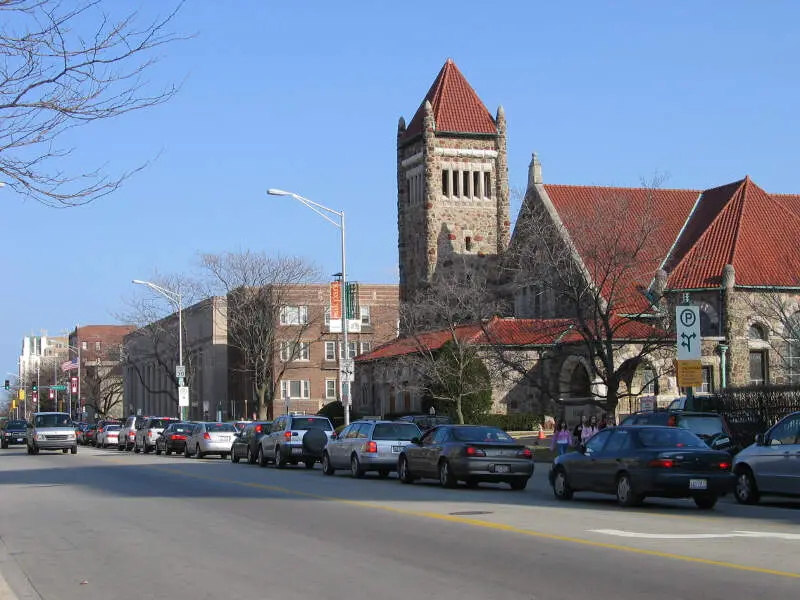
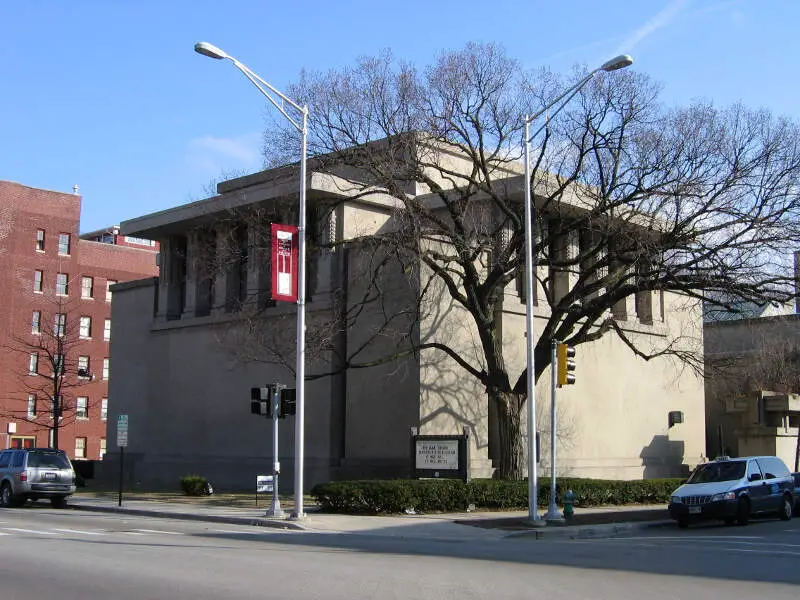
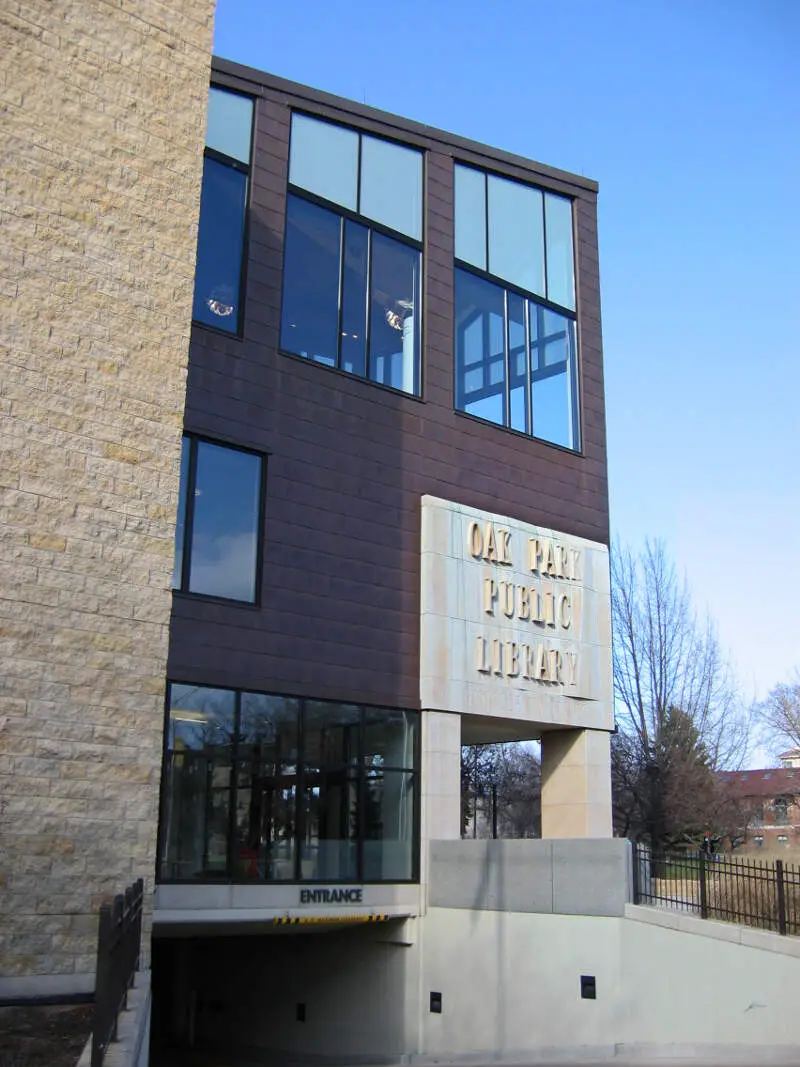
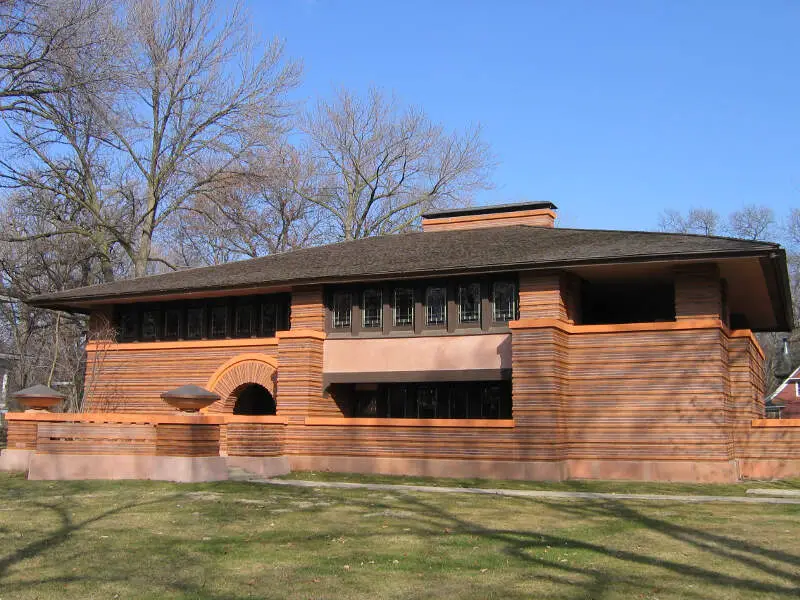
Oak Park, IL Photos


Rankings for Oak Park in Illinois


Locations Around Oak Park
Map Of Oak Park, IL
Best Places Around Oak Park
Wilmette, IL
Population 27,801
Deerfield, IL
Population 19,173
Hinsdale, IL
Population 17,169
Northbrook, IL
Population 34,950
Elmhurst, IL
Population 45,648
Glenview, IL
Population 47,896
Clarendon Hills, IL
Population 8,658
Park Ridge, IL
Population 39,368
Winfield, IL
Population 9,947
Glen Ellyn, IL
Population 28,304
Oak Park Demographics And Statistics
Population over time in Oak Park
The current population in Oak Park is 53,834. The population has increased 4.7% from 2010.
| Year | Population | % Change |
|---|---|---|
| 2022 | 53,834 | 3.1% |
| 2021 | 52,225 | -0.0% |
| 2020 | 52,229 | 0.5% |
| 2019 | 51,989 | -0.2% |
| 2018 | 52,080 | 0.2% |
| 2017 | 51,988 | 0.2% |
| 2016 | 51,902 | 0.2% |
| 2015 | 51,781 | 0.3% |
| 2014 | 51,632 | 0.4% |
| 2013 | 51,426 | - |
Race / Ethnicity in Oak Park
Oak Park is:
60.0% White with 32,324 White residents.
18.8% African American with 10,138 African American residents.
0.1% American Indian with 31 American Indian residents.
5.7% Asian with 3,071 Asian residents.
0.0% Hawaiian with 10 Hawaiian residents.
0.7% Other with 356 Other residents.
5.4% Two Or More with 2,914 Two Or More residents.
9.3% Hispanic with 4,990 Hispanic residents.
| Race | Oak Park | IL | USA |
|---|---|---|---|
| White | 60.0% | 59.6% | 58.9% |
| African American | 18.8% | 13.7% | 12.1% |
| American Indian | 0.1% | 0.1% | 0.6% |
| Asian | 5.7% | 5.7% | 5.7% |
| Hawaiian | 0.0% | 0.0% | 0.2% |
| Other | 0.7% | 0.3% | 0.4% |
| Two Or More | 5.4% | 2.8% | 3.5% |
| Hispanic | 9.3% | 17.8% | 18.7% |
Gender in Oak Park
Oak Park is 54.0% female with 29,083 female residents.
Oak Park is 46.0% male with 24,751 male residents.
| Gender | Oak Park | IL | USA |
|---|---|---|---|
| Female | 54.0% | 50.5% | 50.4% |
| Male | 46.0% | 49.5% | 49.6% |
Highest level of educational attainment in Oak Park for adults over 25
1.0% of adults in Oak Park completed < 9th grade.
2.0% of adults in Oak Park completed 9-12th grade.
8.0% of adults in Oak Park completed high school / ged.
12.0% of adults in Oak Park completed some college.
5.0% of adults in Oak Park completed associate's degree.
33.0% of adults in Oak Park completed bachelor's degree.
26.0% of adults in Oak Park completed master's degree.
8.0% of adults in Oak Park completed professional degree.
5.0% of adults in Oak Park completed doctorate degree.
| Education | Oak Park | IL | USA |
|---|---|---|---|
| < 9th Grade | 1.0% | 6.0% | 4.0% |
| 9-12th Grade | 2.0% | 5.0% | 6.0% |
| High School / GED | 8.0% | 25.0% | 26.0% |
| Some College | 12.0% | 20.0% | 20.0% |
| Associate's Degree | 5.0% | 8.0% | 9.0% |
| Bachelor's Degree | 33.0% | 22.0% | 21.0% |
| Master's Degree | 26.0% | 11.0% | 10.0% |
| Professional Degree | 8.0% | 2.0% | 2.0% |
| Doctorate Degree | 5.0% | 1.0% | 2.0% |
Household Income For Oak Park, Illinois
4.1% of households in Oak Park earn Less than $10,000.
3.0% of households in Oak Park earn $10,000 to $14,999.
4.2% of households in Oak Park earn $15,000 to $24,999.
4.3% of households in Oak Park earn $25,000 to $34,999.
7.1% of households in Oak Park earn $35,000 to $49,999.
13.4% of households in Oak Park earn $50,000 to $74,999.
12.3% of households in Oak Park earn $75,000 to $99,999.
17.2% of households in Oak Park earn $100,000 to $149,999.
11.7% of households in Oak Park earn $150,000 to $199,999.
22.7% of households in Oak Park earn $200,000 or more.
| Income | Oak Park | IL | USA |
|---|---|---|---|
| Less than $10,000 | 4.1% | 5.3% | 4.9% |
| $10,000 to $14,999 | 3.0% | 3.5% | 3.8% |
| $15,000 to $24,999 | 4.2% | 6.7% | 7.0% |
| $25,000 to $34,999 | 4.3% | 7.1% | 7.4% |
| $35,000 to $49,999 | 7.1% | 10.1% | 10.7% |
| $50,000 to $74,999 | 13.4% | 15.4% | 16.1% |
| $75,000 to $99,999 | 12.3% | 12.9% | 12.8% |
| $100,000 to $149,999 | 17.2% | 17.6% | 17.1% |
| $150,000 to $199,999 | 11.7% | 9.4% | 8.8% |
| $200,000 or more | 22.7% | 12.1% | 11.4% |


