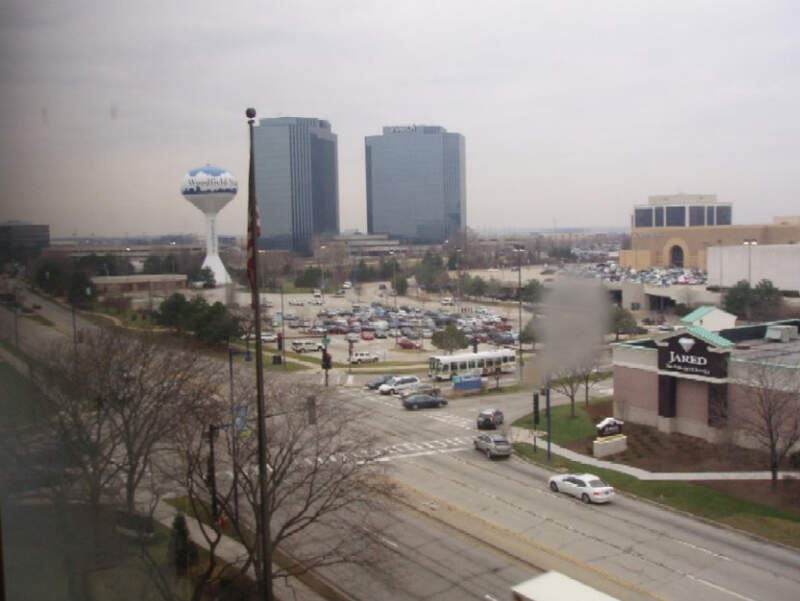
Schaumburg, IL
Demographics And Statistics
Living In Schaumburg, Illinois Summary
Life in Schaumburg research summary. HomeSnacks has been using Saturday Night Science to research the quality of life in Schaumburg over the past nine years using Census, FBI, Zillow, and other primary data sources. Based on the most recently available data, we found the following about life in Schaumburg:
The population in Schaumburg is 77,571.
The median home value in Schaumburg is $304,016.
The median income in Schaumburg is $92,818.
The cost of living in Schaumburg is 114 which is 1.1x higher than the national average.
The median rent in Schaumburg is $1,680.
The unemployment rate in Schaumburg is 3.9%.
The poverty rate in Schaumburg is 6.2%.
The average high in Schaumburg is 58.7° and the average low is 39.0°.
Schaumburg SnackAbility
Overall SnackAbility
Schaumburg, IL Crime Report
Crime in Schaumburg summary. We use data from the FBI to determine the crime rates in Schaumburg. Key points include:
There were 1,682 total crimes in Schaumburg in the last reporting year.
The overall crime rate per 100,000 people in Schaumburg is 2,220.6 / 100k people.
The violent crime rate per 100,000 people in Schaumburg is 91.1 / 100k people.
The property crime rate per 100,000 people in Schaumburg is 2,129.5 / 100k people.
Overall, crime in Schaumburg is -4.46% below the national average.
Total Crimes
Below National Average
Crime In Schaumburg Comparison Table
| Statistic | Count Raw |
Schaumburg / 100k People |
Illinois / 100k People |
National / 100k People |
|---|---|---|---|---|
| Total Crimes Per 100K | 1,682 | 2,220.6 | 1,985.3 | 2,324.2 |
| Violent Crime | 69 | 91.1 | 425.9 | 369.8 |
| Murder | 0 | 0.0 | 9.1 | 6.3 |
| Robbery | 17 | 22.4 | 97.4 | 66.1 |
| Aggravated Assault | 30 | 39.6 | 278.9 | 268.2 |
| Property Crime | 1,613 | 2,129.5 | 1,559.4 | 1,954.4 |
| Burglary | 77 | 101.7 | 246.4 | 269.8 |
| Larceny | 1,441 | 1,902.4 | 1,143.5 | 1,401.9 |
| Car Theft | 95 | 125.4 | 169.5 | 282.7 |
Schaumburg, IL Cost Of Living
Cost of living in Schaumburg summary. We use data on the cost of living to determine how expensive it is to live in Schaumburg. Real estate prices drive most of the variance in cost of living around Illinois. Key points include:
The cost of living in Schaumburg is 114 with 100 being average.
The cost of living in Schaumburg is 1.1x higher than the national average.
The median home value in Schaumburg is $304,016.
The median income in Schaumburg is $92,818.
Schaumburg's Overall Cost Of Living
Higher Than The National Average
Cost Of Living In Schaumburg Comparison Table
| Living Expense | Schaumburg | Illinois | National Average | |
|---|---|---|---|---|
| Overall | 114 | 92 | 100 | |
| Services | 107 | 95 | 100 | |
| Groceries | 105 | 98 | 100 | |
| Health | 114 | 96 | 100 | |
| Housing | 129 | 81 | 100 | |
| Transportation | 126 | 105 | 100 | |
| Utilities | 98 | 90 | 100 | |
Schaumburg, IL Weather
The average high in Schaumburg is 58.7° and the average low is 39.0°.
There are 71.4 days of precipitation each year.
Expect an average of 37.1 inches of precipitation each year with 34.6 inches of snow.
| Stat | Schaumburg |
|---|---|
| Average Annual High | 58.7 |
| Average Annual Low | 39.0 |
| Annual Precipitation Days | 71.4 |
| Average Annual Precipitation | 37.1 |
| Average Annual Snowfall | 34.6 |
Average High
Days of Rain
Schaumburg, IL Photos


1 Reviews & Comments About Schaumburg
/5

HomeSnacks User - 2018-07-15 15:58:54.588531
Schaumburg, while it has a large population, gives the newcomer the impression that its people don't exist, or have been replaced by shopping malls. The traffic is horrendous,and convoluted due to the enormous amount of retail centers it boasts. It is an expensive city, wrapped up in its place as the shopping center to the world and people I know who have lived there were deeply in debt and conspicuous consumers. It has no soul.
Bad things are the confusing street traffic as well as the huge amount of stoplights. It is possible to see your house and not be able to get your car to it for 35 minutes But the library was excellent, and it is easy to get anywhere in the Chicagoland area from the nearby highway systems.
Rankings for Schaumburg in Illinois


Locations Around Schaumburg
Map Of Schaumburg, IL
Best Places Around Schaumburg
Wilmette, IL
Population 27,801
Highland Park, IL
Population 30,209
Buffalo Grove, IL
Population 42,934
Deerfield, IL
Population 19,173
Hinsdale, IL
Population 17,169
Northbrook, IL
Population 34,950
Elmhurst, IL
Population 45,648
Glenview, IL
Population 47,896
Clarendon Hills, IL
Population 8,658
Park Ridge, IL
Population 39,368
Schaumburg Demographics And Statistics
Population over time in Schaumburg
The current population in Schaumburg is 77,571. The population has increased 5.8% from 2010.
| Year | Population | % Change |
|---|---|---|
| 2022 | 77,571 | 4.0% |
| 2021 | 74,569 | 0.2% |
| 2020 | 74,427 | 0.1% |
| 2019 | 74,366 | -0.3% |
| 2018 | 74,559 | -0.0% |
| 2017 | 74,560 | 0.4% |
| 2016 | 74,292 | 0.0% |
| 2015 | 74,276 | 0.7% |
| 2014 | 73,771 | 0.6% |
| 2013 | 73,333 | - |
Race / Ethnicity in Schaumburg
Schaumburg is:
55.0% White with 42,633 White residents.
5.5% African American with 4,294 African American residents.
0.2% American Indian with 127 American Indian residents.
24.5% Asian with 18,968 Asian residents.
0.0% Hawaiian with 10 Hawaiian residents.
0.6% Other with 433 Other residents.
2.6% Two Or More with 2,054 Two Or More residents.
11.7% Hispanic with 9,052 Hispanic residents.
| Race | Schaumburg | IL | USA |
|---|---|---|---|
| White | 55.0% | 59.6% | 58.9% |
| African American | 5.5% | 13.7% | 12.1% |
| American Indian | 0.2% | 0.1% | 0.6% |
| Asian | 24.5% | 5.7% | 5.7% |
| Hawaiian | 0.0% | 0.0% | 0.2% |
| Other | 0.6% | 0.3% | 0.4% |
| Two Or More | 2.6% | 2.8% | 3.5% |
| Hispanic | 11.7% | 17.8% | 18.7% |
Gender in Schaumburg
Schaumburg is 50.6% female with 39,282 female residents.
Schaumburg is 49.4% male with 38,289 male residents.
| Gender | Schaumburg | IL | USA |
|---|---|---|---|
| Female | 50.6% | 50.5% | 50.4% |
| Male | 49.4% | 49.5% | 49.6% |
Highest level of educational attainment in Schaumburg for adults over 25
3.0% of adults in Schaumburg completed < 9th grade.
2.0% of adults in Schaumburg completed 9-12th grade.
20.0% of adults in Schaumburg completed high school / ged.
19.0% of adults in Schaumburg completed some college.
8.0% of adults in Schaumburg completed associate's degree.
30.0% of adults in Schaumburg completed bachelor's degree.
16.0% of adults in Schaumburg completed master's degree.
1.0% of adults in Schaumburg completed professional degree.
1.0% of adults in Schaumburg completed doctorate degree.
| Education | Schaumburg | IL | USA |
|---|---|---|---|
| < 9th Grade | 3.0% | 6.0% | 4.0% |
| 9-12th Grade | 2.0% | 5.0% | 6.0% |
| High School / GED | 20.0% | 25.0% | 26.0% |
| Some College | 19.0% | 20.0% | 20.0% |
| Associate's Degree | 8.0% | 8.0% | 9.0% |
| Bachelor's Degree | 30.0% | 22.0% | 21.0% |
| Master's Degree | 16.0% | 11.0% | 10.0% |
| Professional Degree | 1.0% | 2.0% | 2.0% |
| Doctorate Degree | 1.0% | 1.0% | 2.0% |
Household Income For Schaumburg, Illinois
3.5% of households in Schaumburg earn Less than $10,000.
1.7% of households in Schaumburg earn $10,000 to $14,999.
4.6% of households in Schaumburg earn $15,000 to $24,999.
4.6% of households in Schaumburg earn $25,000 to $34,999.
7.7% of households in Schaumburg earn $35,000 to $49,999.
15.6% of households in Schaumburg earn $50,000 to $74,999.
16.7% of households in Schaumburg earn $75,000 to $99,999.
23.7% of households in Schaumburg earn $100,000 to $149,999.
11.4% of households in Schaumburg earn $150,000 to $199,999.
10.5% of households in Schaumburg earn $200,000 or more.
| Income | Schaumburg | IL | USA |
|---|---|---|---|
| Less than $10,000 | 3.5% | 5.3% | 4.9% |
| $10,000 to $14,999 | 1.7% | 3.5% | 3.8% |
| $15,000 to $24,999 | 4.6% | 6.7% | 7.0% |
| $25,000 to $34,999 | 4.6% | 7.1% | 7.4% |
| $35,000 to $49,999 | 7.7% | 10.1% | 10.7% |
| $50,000 to $74,999 | 15.6% | 15.4% | 16.1% |
| $75,000 to $99,999 | 16.7% | 12.9% | 12.8% |
| $100,000 to $149,999 | 23.7% | 17.6% | 17.1% |
| $150,000 to $199,999 | 11.4% | 9.4% | 8.8% |
| $200,000 or more | 10.5% | 12.1% | 11.4% |


