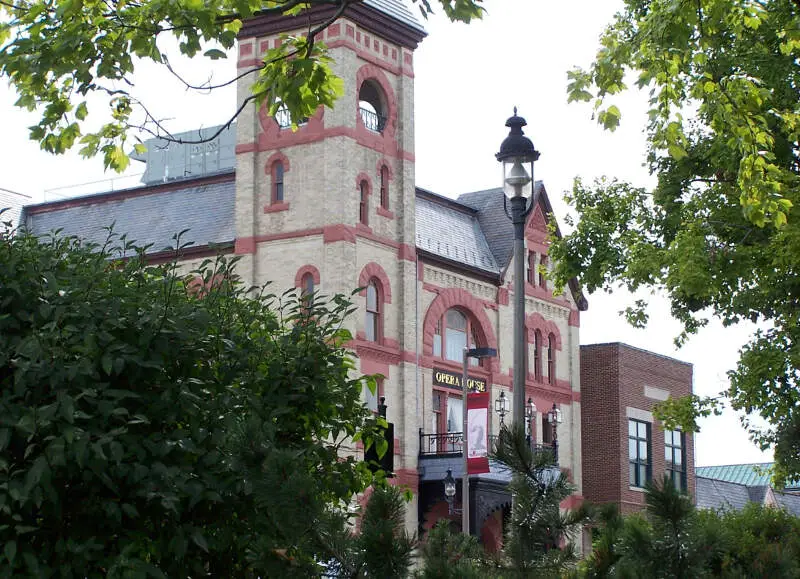
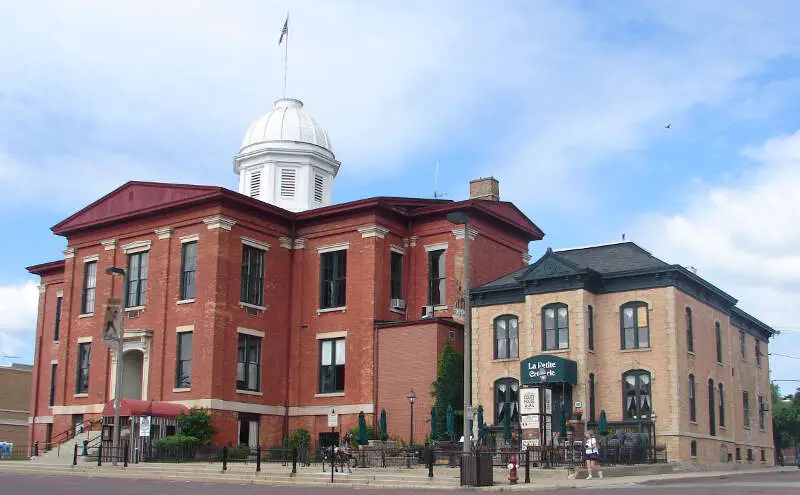
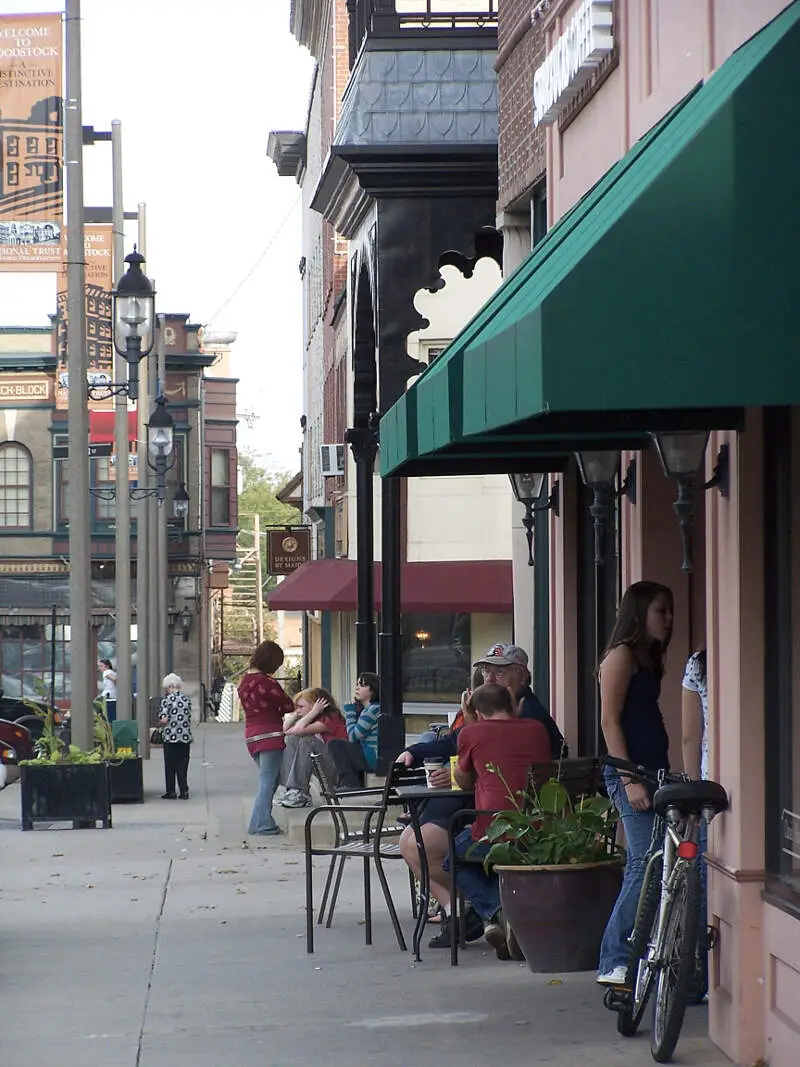
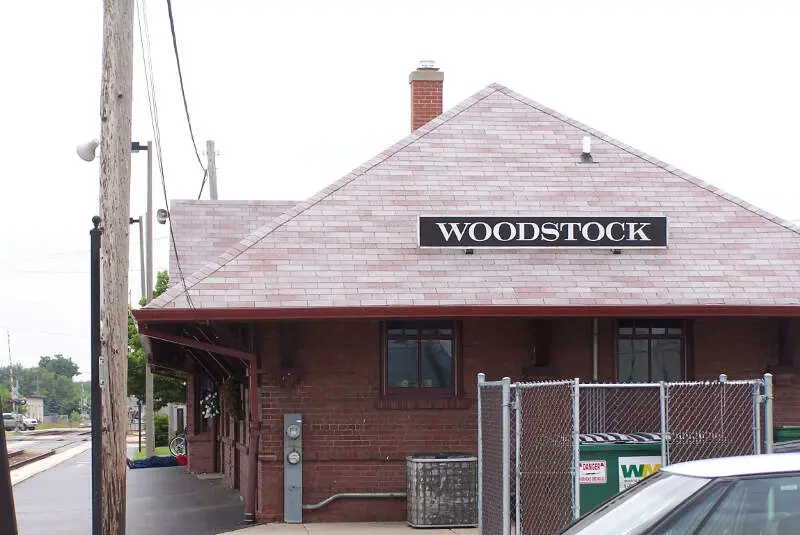
Woodstock, IL
Demographics And Statistics
Living In Woodstock, Illinois Summary
Life in Woodstock research summary. HomeSnacks has been using Saturday Night Science to research the quality of life in Woodstock over the past nine years using Census, FBI, Zillow, and other primary data sources. Based on the most recently available data, we found the following about life in Woodstock:
The population in Woodstock is 26,084.
The median home value in Woodstock is $284,561.
The median income in Woodstock is $82,287.
The cost of living in Woodstock is 96 which is 1.0x lower than the national average.
The median rent in Woodstock is $1,145.
The unemployment rate in Woodstock is 4.8%.
The poverty rate in Woodstock is 8.7%.
The average high in Woodstock is 57.7° and the average low is 37.9°.
Woodstock SnackAbility
Overall SnackAbility
Woodstock, IL Crime Report
Crime in Woodstock summary. We use data from the FBI to determine the crime rates in Woodstock. Key points include:
There were 195 total crimes in Woodstock in the last reporting year.
The overall crime rate per 100,000 people in Woodstock is 756.5 / 100k people.
The violent crime rate per 100,000 people in Woodstock is 58.2 / 100k people.
The property crime rate per 100,000 people in Woodstock is 698.3 / 100k people.
Overall, crime in Woodstock is -67.45% below the national average.
Total Crimes
Below National Average
Crime In Woodstock Comparison Table
| Statistic | Count Raw |
Woodstock / 100k People |
Illinois / 100k People |
National / 100k People |
|---|---|---|---|---|
| Total Crimes Per 100K | 195 | 756.5 | 1,985.3 | 2,324.2 |
| Violent Crime | 15 | 58.2 | 425.9 | 369.8 |
| Murder | 0 | 0.0 | 9.1 | 6.3 |
| Robbery | 2 | 7.8 | 97.4 | 66.1 |
| Aggravated Assault | 7 | 27.2 | 278.9 | 268.2 |
| Property Crime | 180 | 698.3 | 1,559.4 | 1,954.4 |
| Burglary | 3 | 11.6 | 246.4 | 269.8 |
| Larceny | 165 | 640.1 | 1,143.5 | 1,401.9 |
| Car Theft | 12 | 46.6 | 169.5 | 282.7 |
Woodstock, IL Cost Of Living
Cost of living in Woodstock summary. We use data on the cost of living to determine how expensive it is to live in Woodstock. Real estate prices drive most of the variance in cost of living around Illinois. Key points include:
The cost of living in Woodstock is 96 with 100 being average.
The cost of living in Woodstock is 1.0x lower than the national average.
The median home value in Woodstock is $284,561.
The median income in Woodstock is $82,287.
Woodstock's Overall Cost Of Living
Lower Than The National Average
Cost Of Living In Woodstock Comparison Table
| Living Expense | Woodstock | Illinois | National Average | |
|---|---|---|---|---|
| Overall | 96 | 92 | 100 | |
| Services | 89 | 95 | 100 | |
| Groceries | 92 | 98 | 100 | |
| Health | 106 | 96 | 100 | |
| Housing | 91 | 81 | 100 | |
| Transportation | 118 | 105 | 100 | |
| Utilities | 96 | 90 | 100 | |
Woodstock, IL Weather
The average high in Woodstock is 57.7° and the average low is 37.9°.
There are 73.0 days of precipitation each year.
Expect an average of 36.6 inches of precipitation each year with 34.2 inches of snow.
| Stat | Woodstock |
|---|---|
| Average Annual High | 57.7 |
| Average Annual Low | 37.9 |
| Annual Precipitation Days | 73.0 |
| Average Annual Precipitation | 36.6 |
| Average Annual Snowfall | 34.2 |
Average High
Days of Rain
Woodstock, IL Photos
Rankings for Woodstock in Illinois


Locations Around Woodstock
Map Of Woodstock, IL
Best Places Around Woodstock
Lake Zurich, IL
Population 19,749
Hawthorn Woods, IL
Population 9,111
Barrington, IL
Population 11,244
Cary, IL
Population 17,880
Spring Grove, IL
Population 5,694
Lake Villa, IL
Population 8,701
Algonquin, IL
Population 29,888
Lake in the Hills, IL
Population 28,958
Wauconda, IL
Population 14,040
Round Lake, IL
Population 18,677
Woodstock Demographics And Statistics
Population over time in Woodstock
The current population in Woodstock is 26,084. The population has increased 6.8% from 2010.
| Year | Population | % Change |
|---|---|---|
| 2022 | 26,084 | 3.5% |
| 2021 | 25,198 | -0.6% |
| 2020 | 25,340 | 0.4% |
| 2019 | 25,232 | -0.1% |
| 2018 | 25,247 | 0.5% |
| 2017 | 25,121 | 0.8% |
| 2016 | 24,926 | 0.6% |
| 2015 | 24,781 | 1.1% |
| 2014 | 24,512 | 0.4% |
| 2013 | 24,414 | - |
Race / Ethnicity in Woodstock
Woodstock is:
70.6% White with 18,428 White residents.
2.2% African American with 569 African American residents.
0.1% American Indian with 31 American Indian residents.
2.2% Asian with 574 Asian residents.
0.0% Hawaiian with 0 Hawaiian residents.
0.1% Other with 29 Other residents.
2.3% Two Or More with 592 Two Or More residents.
22.5% Hispanic with 5,861 Hispanic residents.
| Race | Woodstock | IL | USA |
|---|---|---|---|
| White | 70.6% | 59.6% | 58.9% |
| African American | 2.2% | 13.7% | 12.1% |
| American Indian | 0.1% | 0.1% | 0.6% |
| Asian | 2.2% | 5.7% | 5.7% |
| Hawaiian | 0.0% | 0.0% | 0.2% |
| Other | 0.1% | 0.3% | 0.4% |
| Two Or More | 2.3% | 2.8% | 3.5% |
| Hispanic | 22.5% | 17.8% | 18.7% |
Gender in Woodstock
Woodstock is 50.8% female with 13,258 female residents.
Woodstock is 49.2% male with 12,826 male residents.
| Gender | Woodstock | IL | USA |
|---|---|---|---|
| Female | 50.8% | 50.5% | 50.4% |
| Male | 49.2% | 49.5% | 49.6% |
Highest level of educational attainment in Woodstock for adults over 25
4.0% of adults in Woodstock completed < 9th grade.
5.0% of adults in Woodstock completed 9-12th grade.
28.0% of adults in Woodstock completed high school / ged.
23.0% of adults in Woodstock completed some college.
8.0% of adults in Woodstock completed associate's degree.
18.0% of adults in Woodstock completed bachelor's degree.
12.0% of adults in Woodstock completed master's degree.
1.0% of adults in Woodstock completed professional degree.
1.0% of adults in Woodstock completed doctorate degree.
| Education | Woodstock | IL | USA |
|---|---|---|---|
| < 9th Grade | 4.0% | 6.0% | 4.0% |
| 9-12th Grade | 5.0% | 5.0% | 6.0% |
| High School / GED | 28.0% | 25.0% | 26.0% |
| Some College | 23.0% | 20.0% | 20.0% |
| Associate's Degree | 8.0% | 8.0% | 9.0% |
| Bachelor's Degree | 18.0% | 22.0% | 21.0% |
| Master's Degree | 12.0% | 11.0% | 10.0% |
| Professional Degree | 1.0% | 2.0% | 2.0% |
| Doctorate Degree | 1.0% | 1.0% | 2.0% |
Household Income For Woodstock, Illinois
4.6% of households in Woodstock earn Less than $10,000.
3.1% of households in Woodstock earn $10,000 to $14,999.
4.5% of households in Woodstock earn $15,000 to $24,999.
7.7% of households in Woodstock earn $25,000 to $34,999.
8.5% of households in Woodstock earn $35,000 to $49,999.
18.5% of households in Woodstock earn $50,000 to $74,999.
14.9% of households in Woodstock earn $75,000 to $99,999.
19.6% of households in Woodstock earn $100,000 to $149,999.
10.3% of households in Woodstock earn $150,000 to $199,999.
8.4% of households in Woodstock earn $200,000 or more.
| Income | Woodstock | IL | USA |
|---|---|---|---|
| Less than $10,000 | 4.6% | 5.3% | 4.9% |
| $10,000 to $14,999 | 3.1% | 3.5% | 3.8% |
| $15,000 to $24,999 | 4.5% | 6.7% | 7.0% |
| $25,000 to $34,999 | 7.7% | 7.1% | 7.4% |
| $35,000 to $49,999 | 8.5% | 10.1% | 10.7% |
| $50,000 to $74,999 | 18.5% | 15.4% | 16.1% |
| $75,000 to $99,999 | 14.9% | 12.9% | 12.8% |
| $100,000 to $149,999 | 19.6% | 17.6% | 17.1% |
| $150,000 to $199,999 | 10.3% | 9.4% | 8.8% |
| $200,000 or more | 8.4% | 12.1% | 11.4% |


