Hobart, IN
Demographics And Statistics
Living In Hobart, Indiana Summary
Life in Hobart research summary. HomeSnacks has been using Saturday Night Science to research the quality of life in Hobart over the past nine years using Census, FBI, Zillow, and other primary data sources. Based on the most recently available data, we found the following about life in Hobart:
The population in Hobart is 29,573.
The median home value in Hobart is $220,976.
The median income in Hobart is $69,398.
The cost of living in Hobart is 99 which is 1.0x lower than the national average.
The median rent in Hobart is $1,176.
The unemployment rate in Hobart is 6.7%.
The poverty rate in Hobart is 14.0%.
The average high in Hobart is 59.7° and the average low is 41.7°.
Hobart SnackAbility
Overall SnackAbility
Hobart, IN Crime Report
Crime in Hobart summary. We use data from the FBI to determine the crime rates in Hobart. Key points include:
There were 656 total crimes in Hobart in the last reporting year.
The overall crime rate per 100,000 people in Hobart is 2,233.3 / 100k people.
The violent crime rate per 100,000 people in Hobart is 98.7 / 100k people.
The property crime rate per 100,000 people in Hobart is 2,134.5 / 100k people.
Overall, crime in Hobart is -3.91% below the national average.
Total Crimes
Below National Average
Crime In Hobart Comparison Table
| Statistic | Count Raw |
Hobart / 100k People |
Indiana / 100k People |
National / 100k People |
|---|---|---|---|---|
| Total Crimes Per 100K | 656 | 2,233.3 | 2,140.9 | 2,324.2 |
| Violent Crime | 29 | 98.7 | 357.7 | 369.8 |
| Murder | 2 | 6.8 | 7.5 | 6.3 |
| Robbery | 5 | 17.0 | 62.4 | 66.1 |
| Aggravated Assault | 19 | 64.7 | 253.0 | 268.2 |
| Property Crime | 627 | 2,134.5 | 1,783.2 | 1,954.4 |
| Burglary | 31 | 105.5 | 280.4 | 269.8 |
| Larceny | 556 | 1,892.8 | 1,274.3 | 1,401.9 |
| Car Theft | 40 | 136.2 | 228.5 | 282.7 |
Hobart, IN Cost Of Living
Cost of living in Hobart summary. We use data on the cost of living to determine how expensive it is to live in Hobart. Real estate prices drive most of the variance in cost of living around Indiana. Key points include:
The cost of living in Hobart is 99 with 100 being average.
The cost of living in Hobart is 1.0x lower than the national average.
The median home value in Hobart is $220,976.
The median income in Hobart is $69,398.
Hobart's Overall Cost Of Living
Lower Than The National Average
Cost Of Living In Hobart Comparison Table
| Living Expense | Hobart | Indiana | National Average | |
|---|---|---|---|---|
| Overall | 99 | 91 | 100 | |
| Services | 105 | 94 | 100 | |
| Groceries | 104 | 96 | 100 | |
| Health | 111 | 101 | 100 | |
| Housing | 81 | 77 | 100 | |
| Transportation | 126 | 95 | 100 | |
| Utilities | 95 | 106 | 100 | |
Hobart, IN Weather
The average high in Hobart is 59.7° and the average low is 41.7°.
There are 74.3 days of precipitation each year.
Expect an average of 38.3 inches of precipitation each year with 31.9 inches of snow.
| Stat | Hobart |
|---|---|
| Average Annual High | 59.7 |
| Average Annual Low | 41.7 |
| Annual Precipitation Days | 74.3 |
| Average Annual Precipitation | 38.3 |
| Average Annual Snowfall | 31.9 |
Average High
Days of Rain
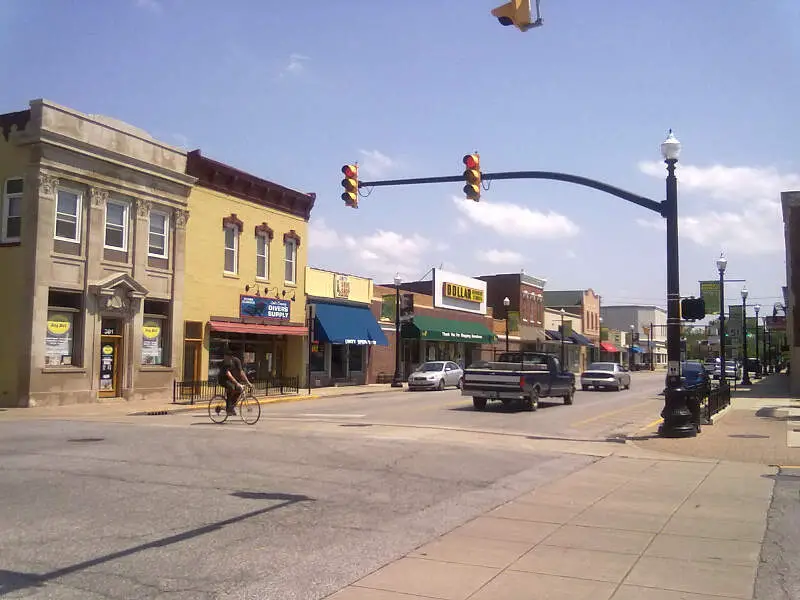
Hobart, IN Photos
Rankings for Hobart in Indiana


Locations Around Hobart
Map Of Hobart, IN
Best Places Around Hobart
South Holland, IL
Population 21,287
Glenwood, IL
Population 8,542
Lansing, IL
Population 28,713
Lynwood, IL
Population 9,087
Dolton, IL
Population 21,283
Crete, IL
Population 8,425
Steger, IL
Population 9,518
Lakes of the Four Seasons, IN
Population 7,589
Munster, IN
Population 23,731
Dyer, IN
Population 16,407
Hobart Demographics And Statistics
Population over time in Hobart
The current population in Hobart is 29,573. The population has increased 4.2% from 2010.
| Year | Population | % Change |
|---|---|---|
| 2022 | 29,573 | 4.5% |
| 2021 | 28,309 | -0.9% |
| 2020 | 28,573 | -0.4% |
| 2019 | 28,693 | -0.9% |
| 2018 | 28,943 | -0.7% |
| 2017 | 29,136 | 0.8% |
| 2016 | 28,894 | -0.1% |
| 2015 | 28,933 | 0.4% |
| 2014 | 28,807 | 1.5% |
| 2013 | 28,389 | - |
Race / Ethnicity in Hobart
Hobart is:
67.9% White with 20,078 White residents.
11.2% African American with 3,308 African American residents.
0.1% American Indian with 25 American Indian residents.
2.0% Asian with 586 Asian residents.
0.0% Hawaiian with 0 Hawaiian residents.
0.2% Other with 54 Other residents.
2.0% Two Or More with 578 Two Or More residents.
16.7% Hispanic with 4,944 Hispanic residents.
| Race | Hobart | IN | USA |
|---|---|---|---|
| White | 67.9% | 77.2% | 58.9% |
| African American | 11.2% | 9.3% | 12.1% |
| American Indian | 0.1% | 0.1% | 0.6% |
| Asian | 2.0% | 2.5% | 5.7% |
| Hawaiian | 0.0% | 0.0% | 0.2% |
| Other | 0.2% | 0.4% | 0.4% |
| Two Or More | 2.0% | 3.0% | 3.5% |
| Hispanic | 16.7% | 7.5% | 18.7% |
Gender in Hobart
Hobart is 51.7% female with 15,300 female residents.
Hobart is 48.3% male with 14,273 male residents.
| Gender | Hobart | IN | USA |
|---|---|---|---|
| Female | 51.7% | 50.4% | 50.4% |
| Male | 48.3% | 49.6% | 49.6% |
Highest level of educational attainment in Hobart for adults over 25
2.0% of adults in Hobart completed < 9th grade.
4.0% of adults in Hobart completed 9-12th grade.
40.0% of adults in Hobart completed high school / ged.
21.0% of adults in Hobart completed some college.
10.0% of adults in Hobart completed associate's degree.
18.0% of adults in Hobart completed bachelor's degree.
5.0% of adults in Hobart completed master's degree.
0.0% of adults in Hobart completed professional degree.
0.0% of adults in Hobart completed doctorate degree.
| Education | Hobart | IN | USA |
|---|---|---|---|
| < 9th Grade | 2.0% | 3.0% | 4.0% |
| 9-12th Grade | 4.0% | 6.0% | 6.0% |
| High School / GED | 40.0% | 33.0% | 26.0% |
| Some College | 21.0% | 20.0% | 20.0% |
| Associate's Degree | 10.0% | 9.0% | 9.0% |
| Bachelor's Degree | 18.0% | 18.0% | 21.0% |
| Master's Degree | 5.0% | 8.0% | 10.0% |
| Professional Degree | 0.0% | 2.0% | 2.0% |
| Doctorate Degree | 0.0% | 1.0% | 2.0% |
Household Income For Hobart, Indiana
3.4% of households in Hobart earn Less than $10,000.
4.5% of households in Hobart earn $10,000 to $14,999.
7.6% of households in Hobart earn $15,000 to $24,999.
6.9% of households in Hobart earn $25,000 to $34,999.
11.3% of households in Hobart earn $35,000 to $49,999.
20.0% of households in Hobart earn $50,000 to $74,999.
15.4% of households in Hobart earn $75,000 to $99,999.
18.4% of households in Hobart earn $100,000 to $149,999.
8.7% of households in Hobart earn $150,000 to $199,999.
3.8% of households in Hobart earn $200,000 or more.
| Income | Hobart | IN | USA |
|---|---|---|---|
| Less than $10,000 | 3.4% | 5.0% | 4.9% |
| $10,000 to $14,999 | 4.5% | 3.7% | 3.8% |
| $15,000 to $24,999 | 7.6% | 7.7% | 7.0% |
| $25,000 to $34,999 | 6.9% | 8.4% | 7.4% |
| $35,000 to $49,999 | 11.3% | 12.5% | 10.7% |
| $50,000 to $74,999 | 20.0% | 18.0% | 16.1% |
| $75,000 to $99,999 | 15.4% | 14.0% | 12.8% |
| $100,000 to $149,999 | 18.4% | 16.8% | 17.1% |
| $150,000 to $199,999 | 8.7% | 7.2% | 8.8% |
| $200,000 or more | 3.8% | 6.7% | 11.4% |


