Madison, IN
Demographics And Statistics
Living In Madison, Indiana Summary
Life in Madison research summary. HomeSnacks has been using Saturday Night Science to research the quality of life in Madison over the past nine years using Census, FBI, Zillow, and other primary data sources. Based on the most recently available data, we found the following about life in Madison:
The population in Madison is 12,301.
The median home value in Madison is $210,391.
The median income in Madison is $53,113.
The cost of living in Madison is 91 which is 0.9x lower than the national average.
The median rent in Madison is $724.
The unemployment rate in Madison is 3.3%.
The poverty rate in Madison is 18.2%.
The average high in Madison is 63.9° and the average low is 43.0°.
Table Of Contents
Madison SnackAbility
Overall SnackAbility
Madison, IN Cost Of Living
Cost of living in Madison summary. We use data on the cost of living to determine how expensive it is to live in Madison. Real estate prices drive most of the variance in cost of living around Indiana. Key points include:
The cost of living in Madison is 91 with 100 being average.
The cost of living in Madison is 0.9x lower than the national average.
The median home value in Madison is $210,391.
The median income in Madison is $53,113.
Madison's Overall Cost Of Living
Lower Than The National Average
Cost Of Living In Madison Comparison Table
| Living Expense | Madison | Indiana | National Average | |
|---|---|---|---|---|
| Overall | 91 | 91 | 100 | |
| Services | 106 | 94 | 100 | |
| Groceries | 95 | 96 | 100 | |
| Health | 78 | 101 | 100 | |
| Housing | 68 | 77 | 100 | |
| Transportation | 113 | 95 | 100 | |
| Utilities | 104 | 106 | 100 | |
Madison, IN Weather
The average high in Madison is 63.9° and the average low is 43.0°.
There are 77.9 days of precipitation each year.
Expect an average of 44.9 inches of precipitation each year with 12.6 inches of snow.
| Stat | Madison |
|---|---|
| Average Annual High | 63.9 |
| Average Annual Low | 43.0 |
| Annual Precipitation Days | 77.9 |
| Average Annual Precipitation | 44.9 |
| Average Annual Snowfall | 12.6 |
Average High
Days of Rain
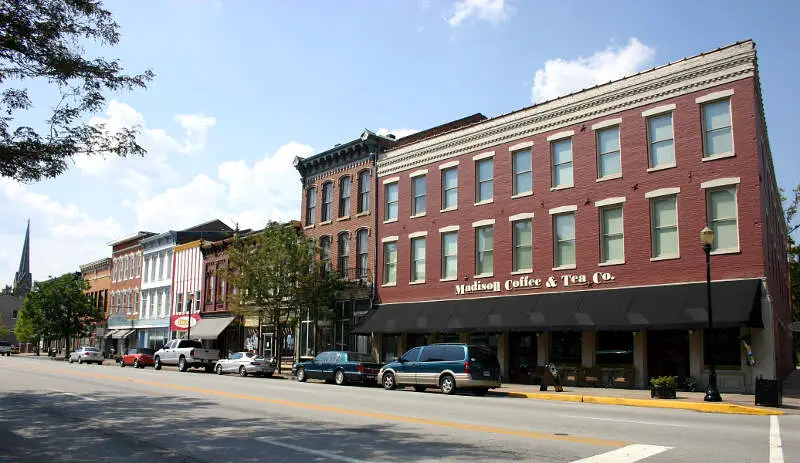
Madison, IN Photos
Madison Articles


Rankings for Madison in Indiana
Locations Around Madison
Map Of Madison, IN
Best Places Around Madison
Mack, OH
Population 11,764
Covedale, OH
Population 6,426
Bridgetown, OH
Population 13,526
Dent, OH
Population 11,666
Harrison, OH
Population 13,086
Villa Hills, KY
Population 7,331
Edgewood, KY
Population 8,447
Prospect, KY
Population 4,624
Madison Demographics And Statistics
Population over time in Madison
The current population in Madison is 12,301. The population has increased 2.6% from 2010.
| Year | Population | % Change |
|---|---|---|
| 2022 | 12,301 | 3.5% |
| 2021 | 11,890 | -0.3% |
| 2020 | 11,920 | -1.0% |
| 2019 | 12,045 | -0.1% |
| 2018 | 12,054 | 0.2% |
| 2017 | 12,033 | 0.0% |
| 2016 | 12,032 | -0.1% |
| 2015 | 12,048 | 0.7% |
| 2014 | 11,967 | -0.2% |
| 2013 | 11,986 | - |
Race / Ethnicity in Madison
Madison is:
89.0% White with 10,953 White residents.
4.4% African American with 542 African American residents.
0.1% American Indian with 14 American Indian residents.
1.4% Asian with 170 Asian residents.
0.0% Hawaiian with 0 Hawaiian residents.
0.3% Other with 43 Other residents.
1.9% Two Or More with 236 Two Or More residents.
2.8% Hispanic with 343 Hispanic residents.
| Race | Madison | IN | USA |
|---|---|---|---|
| White | 89.0% | 77.2% | 58.9% |
| African American | 4.4% | 9.3% | 12.1% |
| American Indian | 0.1% | 0.1% | 0.6% |
| Asian | 1.4% | 2.5% | 5.7% |
| Hawaiian | 0.0% | 0.0% | 0.2% |
| Other | 0.3% | 0.4% | 0.4% |
| Two Or More | 1.9% | 3.0% | 3.5% |
| Hispanic | 2.8% | 7.5% | 18.7% |
Gender in Madison
Madison is 56.4% female with 6,939 female residents.
Madison is 43.6% male with 5,361 male residents.
| Gender | Madison | IN | USA |
|---|---|---|---|
| Female | 56.4% | 50.4% | 50.4% |
| Male | 43.6% | 49.6% | 49.6% |
Highest level of educational attainment in Madison for adults over 25
5.0% of adults in Madison completed < 9th grade.
8.0% of adults in Madison completed 9-12th grade.
36.0% of adults in Madison completed high school / ged.
19.0% of adults in Madison completed some college.
10.0% of adults in Madison completed associate's degree.
13.0% of adults in Madison completed bachelor's degree.
7.0% of adults in Madison completed master's degree.
1.0% of adults in Madison completed professional degree.
1.0% of adults in Madison completed doctorate degree.
| Education | Madison | IN | USA |
|---|---|---|---|
| < 9th Grade | 5.0% | 3.0% | 4.0% |
| 9-12th Grade | 8.0% | 6.0% | 6.0% |
| High School / GED | 36.0% | 33.0% | 26.0% |
| Some College | 19.0% | 20.0% | 20.0% |
| Associate's Degree | 10.0% | 9.0% | 9.0% |
| Bachelor's Degree | 13.0% | 18.0% | 21.0% |
| Master's Degree | 7.0% | 8.0% | 10.0% |
| Professional Degree | 1.0% | 2.0% | 2.0% |
| Doctorate Degree | 1.0% | 1.0% | 2.0% |
Household Income For Madison, Indiana
5.6% of households in Madison earn Less than $10,000.
9.5% of households in Madison earn $10,000 to $14,999.
9.0% of households in Madison earn $15,000 to $24,999.
9.6% of households in Madison earn $25,000 to $34,999.
14.2% of households in Madison earn $35,000 to $49,999.
20.5% of households in Madison earn $50,000 to $74,999.
11.7% of households in Madison earn $75,000 to $99,999.
11.6% of households in Madison earn $100,000 to $149,999.
5.1% of households in Madison earn $150,000 to $199,999.
3.2% of households in Madison earn $200,000 or more.
| Income | Madison | IN | USA |
|---|---|---|---|
| Less than $10,000 | 5.6% | 5.0% | 4.9% |
| $10,000 to $14,999 | 9.5% | 3.7% | 3.8% |
| $15,000 to $24,999 | 9.0% | 7.7% | 7.0% |
| $25,000 to $34,999 | 9.6% | 8.4% | 7.4% |
| $35,000 to $49,999 | 14.2% | 12.5% | 10.7% |
| $50,000 to $74,999 | 20.5% | 18.0% | 16.1% |
| $75,000 to $99,999 | 11.7% | 14.0% | 12.8% |
| $100,000 to $149,999 | 11.6% | 16.8% | 17.1% |
| $150,000 to $199,999 | 5.1% | 7.2% | 8.8% |
| $200,000 or more | 3.2% | 6.7% | 11.4% |


