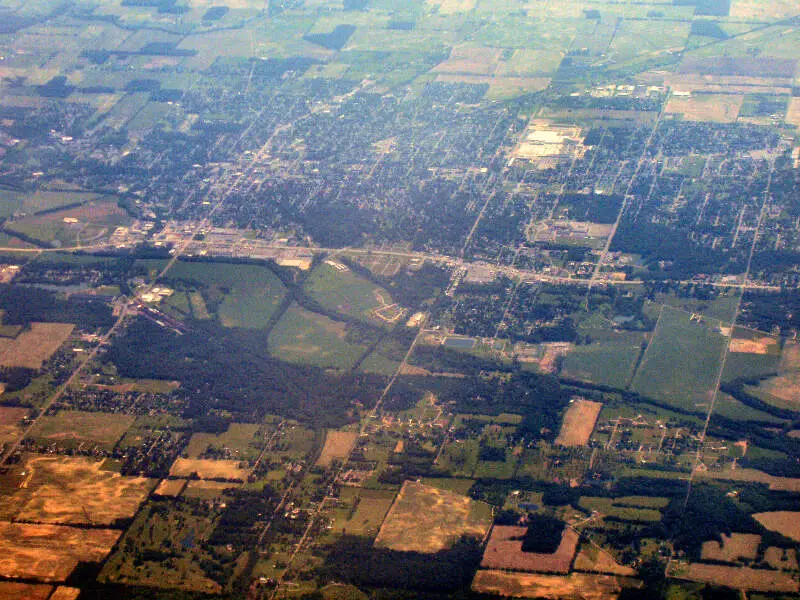
New Castle, IN
Demographics And Statistics
Living In New Castle, Indiana Summary
Life in New Castle research summary. HomeSnacks has been using Saturday Night Science to research the quality of life in New Castle over the past nine years using Census, FBI, Zillow, and other primary data sources. Based on the most recently available data, we found the following about life in New Castle:
The population in New Castle is 17,413.
The median home value in New Castle is $140,164.
The median income in New Castle is $46,925.
The cost of living in New Castle is 85 which is 0.8x lower than the national average.
The median rent in New Castle is $774.
The unemployment rate in New Castle is 5.5%.
The poverty rate in New Castle is 19.4%.
The average high in New Castle is 60.7° and the average low is 40.6°.
Table Of Contents
New Castle SnackAbility
Overall SnackAbility
New Castle, IN Cost Of Living
Cost of living in New Castle summary. We use data on the cost of living to determine how expensive it is to live in New Castle. Real estate prices drive most of the variance in cost of living around Indiana. Key points include:
The cost of living in New Castle is 85 with 100 being average.
The cost of living in New Castle is 0.8x lower than the national average.
The median home value in New Castle is $140,164.
The median income in New Castle is $46,925.
New Castle's Overall Cost Of Living
Lower Than The National Average
Cost Of Living In New Castle Comparison Table
| Living Expense | New Castle | Indiana | National Average | |
|---|---|---|---|---|
| Overall | 85 | 91 | 100 | |
| Services | 96 | 94 | 100 | |
| Groceries | 101 | 96 | 100 | |
| Health | 111 | 101 | 100 | |
| Housing | 44 | 77 | 100 | |
| Transportation | 97 | 95 | 100 | |
| Utilities | 111 | 106 | 100 | |
New Castle, IN Weather
The average high in New Castle is 60.7° and the average low is 40.6°.
There are 81.4 days of precipitation each year.
Expect an average of 43.0 inches of precipitation each year with 24.2 inches of snow.
| Stat | New Castle |
|---|---|
| Average Annual High | 60.7 |
| Average Annual Low | 40.6 |
| Annual Precipitation Days | 81.4 |
| Average Annual Precipitation | 43.0 |
| Average Annual Snowfall | 24.2 |
Average High
Days of Rain
New Castle, IN Photos
Rankings for New Castle in Indiana


Locations Around New Castle
Map Of New Castle, IN
Best Places Around New Castle
Oxford, OH
Population 22,051
Union, OH
Population 6,894
Greenville, OH
Population 12,768
Union, KY
Population 7,369
Middletown, KY
Population 9,594
Zionsville, IN
Population 30,832
Carmel, IN
Population 99,453
Noblesville, IN
Population 70,442
Westfield, IN
Population 48,262
New Castle Demographics And Statistics
Population over time in New Castle
The current population in New Castle is 17,413. The population has decreased -4.4% from 2010.
| Year | Population | % Change |
|---|---|---|
| 2022 | 17,413 | 0.1% |
| 2021 | 17,402 | -0.4% |
| 2020 | 17,476 | -0.9% |
| 2019 | 17,634 | -0.7% |
| 2018 | 17,755 | -0.6% |
| 2017 | 17,859 | -0.5% |
| 2016 | 17,948 | -0.7% |
| 2015 | 18,066 | -0.4% |
| 2014 | 18,142 | -0.4% |
| 2013 | 18,206 | - |
Race / Ethnicity in New Castle
New Castle is:
88.9% White with 15,478 White residents.
4.5% African American with 787 African American residents.
0.0% American Indian with 2 American Indian residents.
0.8% Asian with 141 Asian residents.
0.0% Hawaiian with 0 Hawaiian residents.
0.5% Other with 81 Other residents.
3.2% Two Or More with 565 Two Or More residents.
2.1% Hispanic with 359 Hispanic residents.
| Race | New Castle | IN | USA |
|---|---|---|---|
| White | 88.9% | 77.2% | 58.9% |
| African American | 4.5% | 9.3% | 12.1% |
| American Indian | 0.0% | 0.1% | 0.6% |
| Asian | 0.8% | 2.5% | 5.7% |
| Hawaiian | 0.0% | 0.0% | 0.2% |
| Other | 0.5% | 0.4% | 0.4% |
| Two Or More | 3.2% | 3.0% | 3.5% |
| Hispanic | 2.1% | 7.5% | 18.7% |
Gender in New Castle
New Castle is 48.9% female with 8,520 female residents.
New Castle is 51.1% male with 8,892 male residents.
| Gender | New Castle | IN | USA |
|---|---|---|---|
| Female | 48.9% | 50.4% | 50.4% |
| Male | 51.1% | 49.6% | 49.6% |
Highest level of educational attainment in New Castle for adults over 25
4.0% of adults in New Castle completed < 9th grade.
7.0% of adults in New Castle completed 9-12th grade.
46.0% of adults in New Castle completed high school / ged.
22.0% of adults in New Castle completed some college.
7.0% of adults in New Castle completed associate's degree.
10.0% of adults in New Castle completed bachelor's degree.
4.0% of adults in New Castle completed master's degree.
0.0% of adults in New Castle completed professional degree.
0.0% of adults in New Castle completed doctorate degree.
| Education | New Castle | IN | USA |
|---|---|---|---|
| < 9th Grade | 4.0% | 3.0% | 4.0% |
| 9-12th Grade | 7.0% | 6.0% | 6.0% |
| High School / GED | 46.0% | 33.0% | 26.0% |
| Some College | 22.0% | 20.0% | 20.0% |
| Associate's Degree | 7.0% | 9.0% | 9.0% |
| Bachelor's Degree | 10.0% | 18.0% | 21.0% |
| Master's Degree | 4.0% | 8.0% | 10.0% |
| Professional Degree | 0.0% | 2.0% | 2.0% |
| Doctorate Degree | 0.0% | 1.0% | 2.0% |
Household Income For New Castle, Indiana
6.9% of households in New Castle earn Less than $10,000.
7.8% of households in New Castle earn $10,000 to $14,999.
12.2% of households in New Castle earn $15,000 to $24,999.
10.4% of households in New Castle earn $25,000 to $34,999.
14.8% of households in New Castle earn $35,000 to $49,999.
21.9% of households in New Castle earn $50,000 to $74,999.
12.2% of households in New Castle earn $75,000 to $99,999.
10.2% of households in New Castle earn $100,000 to $149,999.
1.7% of households in New Castle earn $150,000 to $199,999.
1.9% of households in New Castle earn $200,000 or more.
| Income | New Castle | IN | USA |
|---|---|---|---|
| Less than $10,000 | 6.9% | 5.0% | 4.9% |
| $10,000 to $14,999 | 7.8% | 3.7% | 3.8% |
| $15,000 to $24,999 | 12.2% | 7.7% | 7.0% |
| $25,000 to $34,999 | 10.4% | 8.4% | 7.4% |
| $35,000 to $49,999 | 14.8% | 12.5% | 10.7% |
| $50,000 to $74,999 | 21.9% | 18.0% | 16.1% |
| $75,000 to $99,999 | 12.2% | 14.0% | 12.8% |
| $100,000 to $149,999 | 10.2% | 16.8% | 17.1% |
| $150,000 to $199,999 | 1.7% | 7.2% | 8.8% |
| $200,000 or more | 1.9% | 6.7% | 11.4% |


