Princeton, IN
Demographics And Statistics
Living In Princeton, Indiana Summary
Life in Princeton research summary. HomeSnacks has been using Saturday Night Science to research the quality of life in Princeton over the past nine years using Census, FBI, Zillow, and other primary data sources. Based on the most recently available data, we found the following about life in Princeton:
The population in Princeton is 8,344.
The median home value in Princeton is $164,290.
The median income in Princeton is $56,378.
The cost of living in Princeton is 86 which is 0.9x lower than the national average.
The median rent in Princeton is $777.
The unemployment rate in Princeton is 2.7%.
The poverty rate in Princeton is 11.8%.
The average high in Princeton is 65.9° and the average low is 45.6°.
Table Of Contents
Princeton SnackAbility
Overall SnackAbility
Princeton, IN Cost Of Living
Cost of living in Princeton summary. We use data on the cost of living to determine how expensive it is to live in Princeton. Real estate prices drive most of the variance in cost of living around Indiana. Key points include:
The cost of living in Princeton is 86 with 100 being average.
The cost of living in Princeton is 0.9x lower than the national average.
The median home value in Princeton is $164,290.
The median income in Princeton is $56,378.
Princeton's Overall Cost Of Living
Lower Than The National Average
Cost Of Living In Princeton Comparison Table
| Living Expense | Princeton | Indiana | National Average | |
|---|---|---|---|---|
| Overall | 86 | 91 | 100 | |
| Services | 101 | 94 | 100 | |
| Groceries | 95 | 96 | 100 | |
| Health | 91 | 101 | 100 | |
| Housing | 49 | 77 | 100 | |
| Transportation | 97 | 95 | 100 | |
| Utilities | 112 | 106 | 100 | |
Princeton, IN Weather
The average high in Princeton is 65.9° and the average low is 45.6°.
There are 76.4 days of precipitation each year.
Expect an average of 46.3 inches of precipitation each year with 10.9 inches of snow.
| Stat | Princeton |
|---|---|
| Average Annual High | 65.9 |
| Average Annual Low | 45.6 |
| Annual Precipitation Days | 76.4 |
| Average Annual Precipitation | 46.3 |
| Average Annual Snowfall | 10.9 |
Average High
Days of Rain
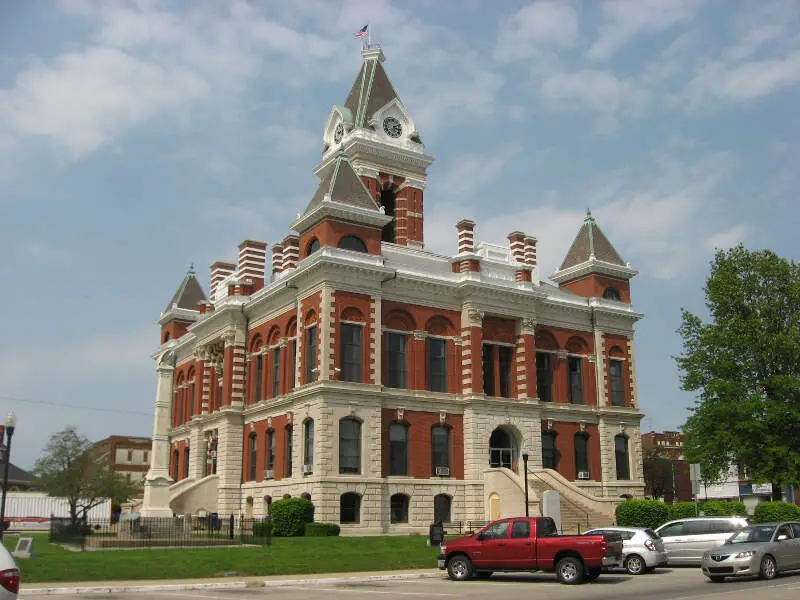
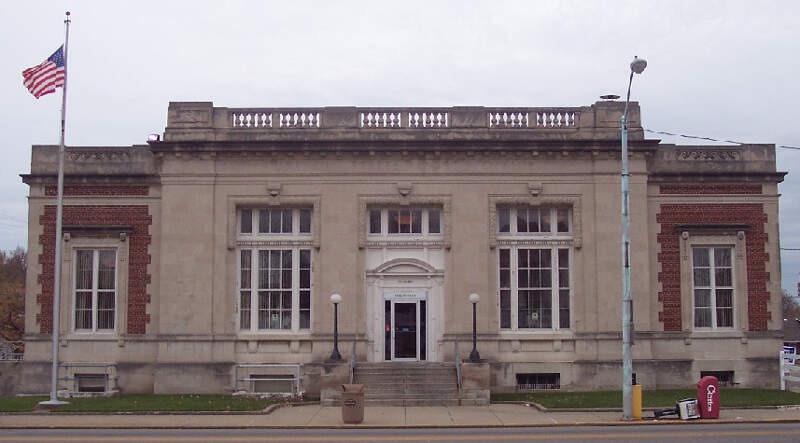
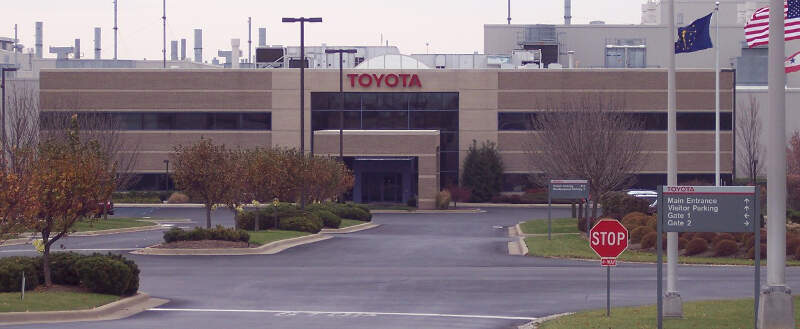
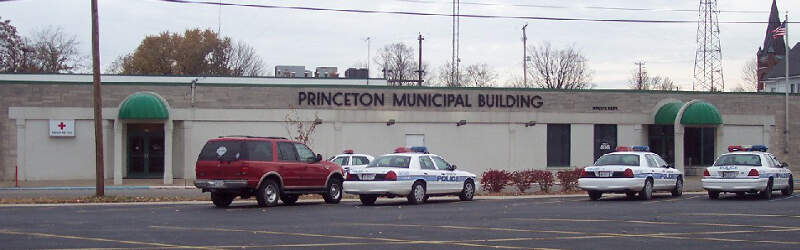
Princeton, IN Photos
Rankings for Princeton in Indiana


Locations Around Princeton
Map Of Princeton, IN
Best Places Around Princeton
Carmi, IL
Population 5,042
Mount Carmel, IL
Population 6,978
Owensboro, KY
Population 60,019
Jasper, IN
Population 16,488
Robinson, IL
Population 7,089
Mount Vernon, IN
Population 6,480
Huntingburg, IN
Population 6,480
Morganfield, KY
Population 3,242
Princeton Demographics And Statistics
Population over time in Princeton
The current population in Princeton is 8,344. The population has decreased -3.3% from 2010.
| Year | Population | % Change |
|---|---|---|
| 2022 | 8,344 | -3.3% |
| 2021 | 8,627 | 0.6% |
| 2020 | 8,573 | -0.5% |
| 2019 | 8,617 | -0.0% |
| 2018 | 8,618 | 0.2% |
| 2017 | 8,600 | -0.2% |
| 2016 | 8,620 | 0.2% |
| 2015 | 8,607 | -0.2% |
| 2014 | 8,625 | -0.1% |
| 2013 | 8,631 | - |
Race / Ethnicity in Princeton
Princeton is:
82.3% White with 6,866 White residents.
5.2% African American with 431 African American residents.
0.0% American Indian with 3 American Indian residents.
0.7% Asian with 57 Asian residents.
2.3% Hawaiian with 190 Hawaiian residents.
0.3% Other with 22 Other residents.
4.1% Two Or More with 342 Two Or More residents.
5.2% Hispanic with 433 Hispanic residents.
| Race | Princeton | IN | USA |
|---|---|---|---|
| White | 82.3% | 77.2% | 58.9% |
| African American | 5.2% | 9.3% | 12.1% |
| American Indian | 0.0% | 0.1% | 0.6% |
| Asian | 0.7% | 2.5% | 5.7% |
| Hawaiian | 2.3% | 0.0% | 0.2% |
| Other | 0.3% | 0.4% | 0.4% |
| Two Or More | 4.1% | 3.0% | 3.5% |
| Hispanic | 5.2% | 7.5% | 18.7% |
Gender in Princeton
Princeton is 48.2% female with 4,025 female residents.
Princeton is 51.8% male with 4,318 male residents.
| Gender | Princeton | IN | USA |
|---|---|---|---|
| Female | 48.2% | 50.4% | 50.4% |
| Male | 51.8% | 49.6% | 49.6% |
Highest level of educational attainment in Princeton for adults over 25
6.0% of adults in Princeton completed < 9th grade.
8.0% of adults in Princeton completed 9-12th grade.
48.0% of adults in Princeton completed high school / ged.
20.0% of adults in Princeton completed some college.
7.0% of adults in Princeton completed associate's degree.
9.0% of adults in Princeton completed bachelor's degree.
2.0% of adults in Princeton completed master's degree.
0.0% of adults in Princeton completed professional degree.
0.0% of adults in Princeton completed doctorate degree.
| Education | Princeton | IN | USA |
|---|---|---|---|
| < 9th Grade | 6.0% | 3.0% | 4.0% |
| 9-12th Grade | 8.0% | 6.0% | 6.0% |
| High School / GED | 48.0% | 33.0% | 26.0% |
| Some College | 20.0% | 20.0% | 20.0% |
| Associate's Degree | 7.0% | 9.0% | 9.0% |
| Bachelor's Degree | 9.0% | 18.0% | 21.0% |
| Master's Degree | 2.0% | 8.0% | 10.0% |
| Professional Degree | 0.0% | 2.0% | 2.0% |
| Doctorate Degree | 0.0% | 1.0% | 2.0% |
Household Income For Princeton, Indiana
2.7% of households in Princeton earn Less than $10,000.
3.3% of households in Princeton earn $10,000 to $14,999.
10.8% of households in Princeton earn $15,000 to $24,999.
11.5% of households in Princeton earn $25,000 to $34,999.
13.8% of households in Princeton earn $35,000 to $49,999.
21.9% of households in Princeton earn $50,000 to $74,999.
16.8% of households in Princeton earn $75,000 to $99,999.
12.2% of households in Princeton earn $100,000 to $149,999.
4.4% of households in Princeton earn $150,000 to $199,999.
2.6% of households in Princeton earn $200,000 or more.
| Income | Princeton | IN | USA |
|---|---|---|---|
| Less than $10,000 | 2.7% | 5.0% | 4.9% |
| $10,000 to $14,999 | 3.3% | 3.7% | 3.8% |
| $15,000 to $24,999 | 10.8% | 7.7% | 7.0% |
| $25,000 to $34,999 | 11.5% | 8.4% | 7.4% |
| $35,000 to $49,999 | 13.8% | 12.5% | 10.7% |
| $50,000 to $74,999 | 21.9% | 18.0% | 16.1% |
| $75,000 to $99,999 | 16.8% | 14.0% | 12.8% |
| $100,000 to $149,999 | 12.2% | 16.8% | 17.1% |
| $150,000 to $199,999 | 4.4% | 7.2% | 8.8% |
| $200,000 or more | 2.6% | 6.7% | 11.4% |


