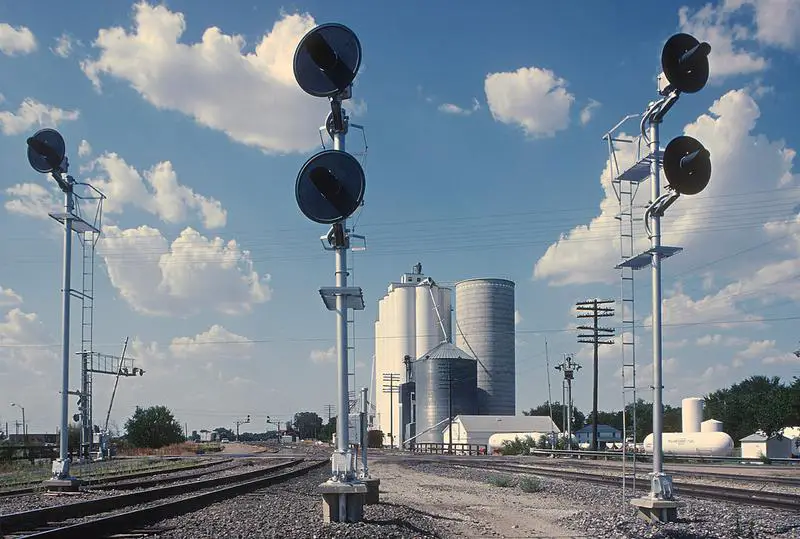
Mulvane, KS
Demographics And Statistics
Living In Mulvane, Kansas Summary
Life in Mulvane research summary. HomeSnacks has been using Saturday Night Science to research the quality of life in Mulvane over the past nine years using Census, FBI, Zillow, and other primary data sources. Based on the most recently available data, we found the following about life in Mulvane:
The population in Mulvane is 6,003.
The median home value in Mulvane is $215,120.
The median income in Mulvane is $67,766.
The cost of living in Mulvane is 90 which is 0.9x lower than the national average.
The median rent in Mulvane is $1,148.
The unemployment rate in Mulvane is 7.5%.
The poverty rate in Mulvane is 15.3%.
The average high in Mulvane is 68.1° and the average low is 45.9°.
Mulvane SnackAbility
Overall SnackAbility
Mulvane, KS Crime Report
Crime in Mulvane summary. We use data from the FBI to determine the crime rates in Mulvane. Key points include:
There were 109 total crimes in Mulvane in the last reporting year.
The overall crime rate per 100,000 people in Mulvane is 1,592.6 / 100k people.
The violent crime rate per 100,000 people in Mulvane is 102.3 / 100k people.
The property crime rate per 100,000 people in Mulvane is 1,490.4 / 100k people.
Overall, crime in Mulvane is -31.48% below the national average.
Total Crimes
Below National Average
Crime In Mulvane Comparison Table
| Statistic | Count Raw |
Mulvane / 100k People |
Kansas / 100k People |
National / 100k People |
|---|---|---|---|---|
| Total Crimes Per 100K | 109 | 1,592.6 | 2,624.1 | 2,324.2 |
| Violent Crime | 7 | 102.3 | 425.0 | 369.8 |
| Murder | 0 | 0.0 | 3.4 | 6.3 |
| Robbery | 2 | 29.2 | 31.8 | 66.1 |
| Aggravated Assault | 3 | 43.8 | 346.4 | 268.2 |
| Property Crime | 102 | 1,490.4 | 2,199.1 | 1,954.4 |
| Burglary | 10 | 146.1 | 331.4 | 269.8 |
| Larceny | 86 | 1,256.6 | 1,619.6 | 1,401.9 |
| Car Theft | 6 | 87.7 | 248.1 | 282.7 |
Mulvane, KS Cost Of Living
Cost of living in Mulvane summary. We use data on the cost of living to determine how expensive it is to live in Mulvane. Real estate prices drive most of the variance in cost of living around Kansas. Key points include:
The cost of living in Mulvane is 90 with 100 being average.
The cost of living in Mulvane is 0.9x lower than the national average.
The median home value in Mulvane is $215,120.
The median income in Mulvane is $67,766.
Mulvane's Overall Cost Of Living
Lower Than The National Average
Cost Of Living In Mulvane Comparison Table
| Living Expense | Mulvane | Kansas | National Average | |
|---|---|---|---|---|
| Overall | 90 | 87 | 100 | |
| Services | 102 | 90 | 100 | |
| Groceries | 101 | 95 | 100 | |
| Health | 93 | 98 | 100 | |
| Housing | 72 | 70 | 100 | |
| Transportation | 97 | 93 | 100 | |
| Utilities | 99 | 102 | 100 | |
Mulvane, KS Weather
The average high in Mulvane is 68.1° and the average low is 45.9°.
There are 55.7 days of precipitation each year.
Expect an average of 35.1 inches of precipitation each year with 10.4 inches of snow.
| Stat | Mulvane |
|---|---|
| Average Annual High | 68.1 |
| Average Annual Low | 45.9 |
| Annual Precipitation Days | 55.7 |
| Average Annual Precipitation | 35.1 |
| Average Annual Snowfall | 10.4 |
Average High
Days of Rain
Mulvane, KS Photos
1 Reviews & Comments About Mulvane
/5

HomeSnacks User - 2018-07-14 04:38:26.584130
I began my time in Mulvane at grade 5. I graduated here with a 2.9 GPA which I could have done better. The town is a small town, people are friendly, and everyone knows your name. I love that this town is full of country people, people that don't do "city" life.
The bad is that it is a small town, when there is some sort of drama, the whole town will know in a matter of moments. On the flip side, when you are in times of the need, Mulvane will buck down and help out a fellow Mulvanian.
Rankings for Mulvane in Kansas


Locations Around Mulvane
Map Of Mulvane, KS
Best Places Around Mulvane
Rose Hill, KS
Population 4,357
Andover, KS
Population 15,460
Derby, KS
Population 25,551
Haysville, KS
Population 10,891
Wellington, KS
Population 7,710
Wichita, KS
Population 395,951
Mulvane Demographics And Statistics
Population over time in Mulvane
The current population in Mulvane is 6,003. The population has decreased -4.6% from 2010.
| Year | Population | % Change |
|---|---|---|
| 2022 | 6,003 | 5.0% |
| 2021 | 5,719 | 5.7% |
| 2020 | 5,413 | -0.9% |
| 2019 | 5,461 | -2.6% |
| 2018 | 5,607 | -6.6% |
| 2017 | 6,000 | -1.0% |
| 2016 | 6,058 | 1.7% |
| 2015 | 5,957 | -4.0% |
| 2014 | 6,206 | -1.4% |
| 2013 | 6,291 | - |
Race / Ethnicity in Mulvane
Mulvane is:
91.2% White with 5,473 White residents.
0.4% African American with 27 African American residents.
0.0% American Indian with 0 American Indian residents.
0.0% Asian with 0 Asian residents.
0.0% Hawaiian with 0 Hawaiian residents.
0.3% Other with 21 Other residents.
5.1% Two Or More with 306 Two Or More residents.
2.9% Hispanic with 176 Hispanic residents.
| Race | Mulvane | KS | USA |
|---|---|---|---|
| White | 91.2% | 74.2% | 58.9% |
| African American | 0.4% | 5.4% | 12.1% |
| American Indian | 0.0% | 0.5% | 0.6% |
| Asian | 0.0% | 3.0% | 5.7% |
| Hawaiian | 0.0% | 0.1% | 0.2% |
| Other | 0.3% | 0.3% | 0.4% |
| Two Or More | 5.1% | 4.0% | 3.5% |
| Hispanic | 2.9% | 12.6% | 18.7% |
Gender in Mulvane
Mulvane is 53.4% female with 3,206 female residents.
Mulvane is 46.6% male with 2,797 male residents.
| Gender | Mulvane | KS | USA |
|---|---|---|---|
| Female | 53.4% | 49.8% | 50.4% |
| Male | 46.6% | 50.2% | 49.6% |
Highest level of educational attainment in Mulvane for adults over 25
0.0% of adults in Mulvane completed < 9th grade.
2.0% of adults in Mulvane completed 9-12th grade.
27.0% of adults in Mulvane completed high school / ged.
29.0% of adults in Mulvane completed some college.
9.0% of adults in Mulvane completed associate's degree.
20.0% of adults in Mulvane completed bachelor's degree.
12.0% of adults in Mulvane completed master's degree.
1.0% of adults in Mulvane completed professional degree.
0.0% of adults in Mulvane completed doctorate degree.
| Education | Mulvane | KS | USA |
|---|---|---|---|
| < 9th Grade | 0.0% | 2.0% | 4.0% |
| 9-12th Grade | 2.0% | 5.0% | 6.0% |
| High School / GED | 27.0% | 26.0% | 26.0% |
| Some College | 29.0% | 23.0% | 20.0% |
| Associate's Degree | 9.0% | 9.0% | 9.0% |
| Bachelor's Degree | 20.0% | 22.0% | 21.0% |
| Master's Degree | 12.0% | 10.0% | 10.0% |
| Professional Degree | 1.0% | 2.0% | 2.0% |
| Doctorate Degree | 0.0% | 1.0% | 2.0% |
Household Income For Mulvane, Kansas
3.4% of households in Mulvane earn Less than $10,000.
1.3% of households in Mulvane earn $10,000 to $14,999.
6.2% of households in Mulvane earn $15,000 to $24,999.
8.1% of households in Mulvane earn $25,000 to $34,999.
11.8% of households in Mulvane earn $35,000 to $49,999.
25.0% of households in Mulvane earn $50,000 to $74,999.
12.0% of households in Mulvane earn $75,000 to $99,999.
19.3% of households in Mulvane earn $100,000 to $149,999.
7.3% of households in Mulvane earn $150,000 to $199,999.
5.5% of households in Mulvane earn $200,000 or more.
| Income | Mulvane | KS | USA |
|---|---|---|---|
| Less than $10,000 | 3.4% | 4.5% | 4.9% |
| $10,000 to $14,999 | 1.3% | 3.6% | 3.8% |
| $15,000 to $24,999 | 6.2% | 7.2% | 7.0% |
| $25,000 to $34,999 | 8.1% | 8.2% | 7.4% |
| $35,000 to $49,999 | 11.8% | 11.9% | 10.7% |
| $50,000 to $74,999 | 25.0% | 18.0% | 16.1% |
| $75,000 to $99,999 | 12.0% | 13.5% | 12.8% |
| $100,000 to $149,999 | 19.3% | 17.1% | 17.1% |
| $150,000 to $199,999 | 7.3% | 7.9% | 8.8% |
| $200,000 or more | 5.5% | 8.0% | 11.4% |


