Louisville, KY
Demographics And Statistics
Living In Louisville, Kentucky Summary
Life in Louisville research summary. HomeSnacks has been using Saturday Night Science to research the quality of life in Louisville over the past nine years using Census, FBI, Zillow, and other primary data sources. Based on the most recently available data, we found the following about life in Louisville:
The population in Louisville is 629,176.
The median home value in Louisville is $231,566.
The median income in Louisville is $63,114.
The cost of living in Louisville is 94 which is 0.9x lower than the national average.
The median rent in Louisville is $1,014.
The unemployment rate in Louisville is 5.3%.
The poverty rate in Louisville is 15.6%.
The average high in Louisville is 67.0° and the average low is 46.7°.
Table Of Contents
Louisville SnackAbility
Overall SnackAbility
Louisville, KY Cost Of Living
Cost of living in Louisville summary. We use data on the cost of living to determine how expensive it is to live in Louisville. Real estate prices drive most of the variance in cost of living around Kentucky. Key points include:
The cost of living in Louisville is 94 with 100 being average.
The cost of living in Louisville is 0.9x lower than the national average.
The median home value in Louisville is $231,566.
The median income in Louisville is $63,114.
Louisville's Overall Cost Of Living
Lower Than The National Average
Cost Of Living In Louisville Comparison Table
| Living Expense | Louisville | Kentucky | National Average | |
|---|---|---|---|---|
| Overall | 94 | 94 | 100 | |
| Services | 108 | 105 | 100 | |
| Groceries | 92 | 97 | 100 | |
| Health | 74 | 79 | 100 | |
| Housing | 78 | 75 | 100 | |
| Transportation | 113 | 102 | 100 | |
| Utilities | 107 | 106 | 100 | |
Louisville, KY Weather
The average high in Louisville is 67.0° and the average low is 46.7°.
There are 76.3 days of precipitation each year.
Expect an average of 45.4 inches of precipitation each year with 9.1 inches of snow.
| Stat | Louisville |
|---|---|
| Average Annual High | 67.0 |
| Average Annual Low | 46.7 |
| Annual Precipitation Days | 76.3 |
| Average Annual Precipitation | 45.4 |
| Average Annual Snowfall | 9.1 |
Average High
Days of Rain
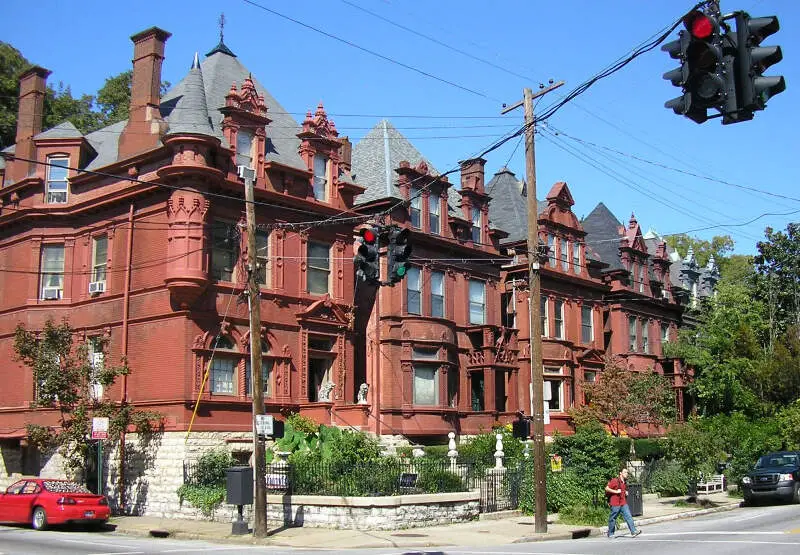
Louisville, KY Photos


6 Reviews & Comments About Louisville
/5

Crybaby Xoxo -
I live in Kentucky and I'd say Louisville is pretty dangerous
HomeSnacks User - 2018-08-03 15:52:42.945933
It is a scary place with barely any jobs and its just a lot of farming.
It is very poor and no jobs at all.
HomeSnacks User - 2018-08-04 22:58:41.636305
Louisville is a bustling city with many food and entertain attractions to visit. The food scene is very diverse, wonderful parks to go and walk around, and overall a very nice city to be in.
My favorite place in Louisville is Water Front Park by the Ohio River, where they have the walking bridge where you can walk across the river to the Indiana side. It is very beautiful at night and safety is always first for the city.
HomeSnacks User - 2018-08-05 07:00:29.909754
There are many things to do in Louisville! We have a revitalized waterfront that continues to grow stronger and offer more activities for the public each year. From free waterfront concerts each Wednesday in the summer to a wide array of delicious eateries, you're sure to find something you enjoy.
For such a "small" city, Louisville has a variety of art and music and food. Louisville has pretty decent cost of living, and has quite a bit of history to it, being a river city. If you can put up with the occasional ignorant redneck, you might just love it here.
HomeSnacks User - 2018-09-10 16:57:57.810845
The crime rates are horrible. In some areas there are shootings nearly every week if not more often. Some of the schools are good, and some are awful depending where you are, none of them are excellent though. Easy to travel though and a lot of jobs.
My favorite places to visit are the clubs and resturants in the area. I would avoid downtown as much as possible though, lot of traffic and a lot of not so great people there.
HomeSnacks User - 2019-03-04 22:45:57.318268
The other comment is just untrue and dramatic. Jobs are out there, they just might not be the most luxurious. Finding a job is quite easy if you lower your standards. Lived here for a year and never had anything happen to me or feel like I was in danger.
A lot of the city looks poor and outdated besides the s****y east end.
Louisville Articles

Rankings for Louisville in Kentucky


Locations Around Louisville
Map Of Louisville, KY
Best Places Around Louisville
Louisville Demographics And Statistics
Population over time in Louisville
The current population in Louisville is 629,176. The population has increased 7.2% from 2010.
| Year | Population | % Change |
|---|---|---|
| 2022 | 629,176 | 2.0% |
| 2021 | 617,032 | 0.3% |
| 2020 | 615,478 | 0.6% |
| 2019 | 611,573 | 0.5% |
| 2018 | 608,732 | 0.5% |
| 2017 | 605,762 | 0.7% |
| 2016 | 601,611 | 0.7% |
| 2015 | 597,231 | 0.8% |
| 2014 | 592,529 | 0.9% |
| 2013 | 586,994 | - |
Race / Ethnicity in Louisville
Louisville is:
62.9% White with 395,983 White residents.
23.6% African American with 148,787 African American residents.
0.1% American Indian with 341 American Indian residents.
2.7% Asian with 16,745 Asian residents.
0.1% Hawaiian with 324 Hawaiian residents.
0.4% Other with 2,508 Other residents.
3.4% Two Or More with 21,486 Two Or More residents.
6.8% Hispanic with 43,002 Hispanic residents.
| Race | Louisville | KY | USA |
|---|---|---|---|
| White | 62.9% | 83.2% | 58.9% |
| African American | 23.6% | 7.9% | 12.1% |
| American Indian | 0.1% | 0.1% | 0.6% |
| Asian | 2.7% | 1.5% | 5.7% |
| Hawaiian | 0.1% | 0.1% | 0.2% |
| Other | 0.4% | 0.2% | 0.4% |
| Two Or More | 3.4% | 2.9% | 3.5% |
| Hispanic | 6.8% | 4.0% | 18.7% |
Gender in Louisville
Louisville is 51.2% female with 321,974 female residents.
Louisville is 48.8% male with 307,201 male residents.
| Gender | Louisville | KY | USA |
|---|---|---|---|
| Female | 51.2% | 50.4% | 50.4% |
| Male | 48.8% | 49.6% | 49.6% |
Highest level of educational attainment in Louisville for adults over 25
3.0% of adults in Louisville completed < 9th grade.
7.0% of adults in Louisville completed 9-12th grade.
28.0% of adults in Louisville completed high school / ged.
21.0% of adults in Louisville completed some college.
8.0% of adults in Louisville completed associate's degree.
20.0% of adults in Louisville completed bachelor's degree.
9.0% of adults in Louisville completed master's degree.
2.0% of adults in Louisville completed professional degree.
2.0% of adults in Louisville completed doctorate degree.
| Education | Louisville | KY | USA |
|---|---|---|---|
| < 9th Grade | 3.0% | 4.0% | 4.0% |
| 9-12th Grade | 7.0% | 7.0% | 6.0% |
| High School / GED | 28.0% | 33.0% | 26.0% |
| Some College | 21.0% | 20.0% | 20.0% |
| Associate's Degree | 8.0% | 9.0% | 9.0% |
| Bachelor's Degree | 20.0% | 16.0% | 21.0% |
| Master's Degree | 9.0% | 8.0% | 10.0% |
| Professional Degree | 2.0% | 2.0% | 2.0% |
| Doctorate Degree | 2.0% | 1.0% | 2.0% |
Household Income For Louisville, Kentucky
5.7% of households in Louisville earn Less than $10,000.
4.8% of households in Louisville earn $10,000 to $14,999.
8.4% of households in Louisville earn $15,000 to $24,999.
8.5% of households in Louisville earn $25,000 to $34,999.
12.5% of households in Louisville earn $35,000 to $49,999.
17.8% of households in Louisville earn $50,000 to $74,999.
13.2% of households in Louisville earn $75,000 to $99,999.
15.0% of households in Louisville earn $100,000 to $149,999.
6.8% of households in Louisville earn $150,000 to $199,999.
7.4% of households in Louisville earn $200,000 or more.
| Income | Louisville | KY | USA |
|---|---|---|---|
| Less than $10,000 | 5.7% | 6.1% | 4.9% |
| $10,000 to $14,999 | 4.8% | 5.6% | 3.8% |
| $15,000 to $24,999 | 8.4% | 9.0% | 7.0% |
| $25,000 to $34,999 | 8.5% | 9.1% | 7.4% |
| $35,000 to $49,999 | 12.5% | 12.4% | 10.7% |
| $50,000 to $74,999 | 17.8% | 17.4% | 16.1% |
| $75,000 to $99,999 | 13.2% | 12.8% | 12.8% |
| $100,000 to $149,999 | 15.0% | 15.2% | 17.1% |
| $150,000 to $199,999 | 6.8% | 6.3% | 8.8% |
| $200,000 or more | 7.4% | 6.0% | 11.4% |


