Denham Springs, LA
Demographics And Statistics
Living In Denham Springs, Louisiana Summary
Life in Denham Springs research summary. HomeSnacks has been using Saturday Night Science to research the quality of life in Denham Springs over the past nine years using Census, FBI, Zillow, and other primary data sources. Based on the most recently available data, we found the following about life in Denham Springs:
The population in Denham Springs is 9,393.
The median home value in Denham Springs is $240,723.
The median income in Denham Springs is $85,625.
The cost of living in Denham Springs is 94 which is 0.9x lower than the national average.
The median rent in Denham Springs is $1,064.
The unemployment rate in Denham Springs is 7.4%.
The poverty rate in Denham Springs is 5.8%.
The average high in Denham Springs is 78.0° and the average low is 56.5°.
Table Of Contents
Denham Springs SnackAbility
Overall SnackAbility
Denham Springs, LA Cost Of Living
Cost of living in Denham Springs summary. We use data on the cost of living to determine how expensive it is to live in Denham Springs. Real estate prices drive most of the variance in cost of living around Louisiana. Key points include:
The cost of living in Denham Springs is 94 with 100 being average.
The cost of living in Denham Springs is 0.9x lower than the national average.
The median home value in Denham Springs is $240,723.
The median income in Denham Springs is $85,625.
Denham Springs's Overall Cost Of Living
Lower Than The National Average
Cost Of Living In Denham Springs Comparison Table
| Living Expense | Denham Springs | Louisiana | National Average | |
|---|---|---|---|---|
| Overall | 94 | 92 | 100 | |
| Services | 104 | 96 | 100 | |
| Groceries | 100 | 96 | 100 | |
| Health | 96 | 99 | 100 | |
| Housing | 79 | 83 | 100 | |
| Transportation | 111 | 96 | 100 | |
| Utilities | 73 | 86 | 100 | |
Denham Springs, LA Weather
The average high in Denham Springs is 78.0° and the average low is 56.5°.
There are 67.5 days of precipitation each year.
Expect an average of 63.0 inches of precipitation each year with 0.1 inches of snow.
| Stat | Denham Springs |
|---|---|
| Average Annual High | 78.0 |
| Average Annual Low | 56.5 |
| Annual Precipitation Days | 67.5 |
| Average Annual Precipitation | 63.0 |
| Average Annual Snowfall | 0.1 |
Average High
Days of Rain
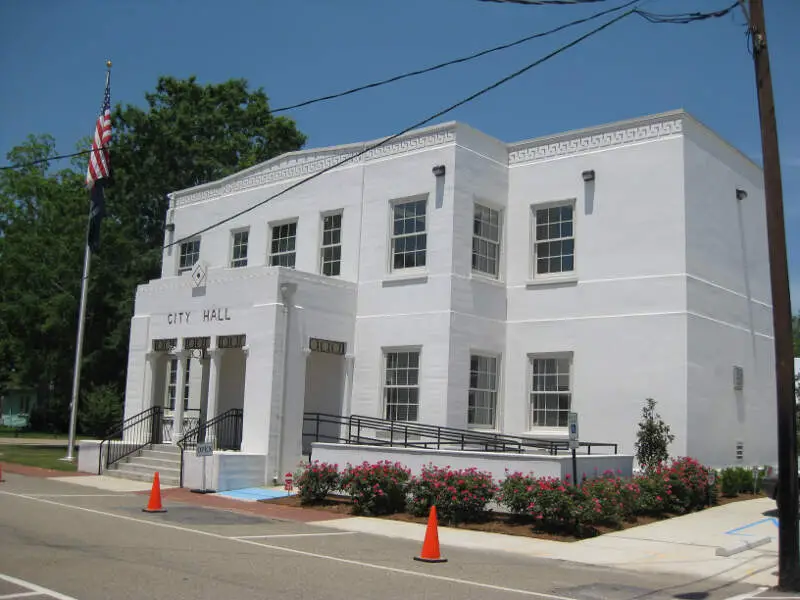
Denham Springs, LA Photos
1 Reviews & Comments About Denham Springs
/5

HomeSnacks User - 2019-03-31 04:23:02.372074
The schools around here are so bad. I had a health teacher tell me that men can't get breast cancer. The college my mom goes to is awful too.
I heard that Louisiana has by far the highest murder rate than any other state and that is it is the prison capital of the entire world. It is the most corrupt state.
Rankings for Denham Springs in Louisiana


Locations Around Denham Springs
Map Of Denham Springs, LA
Best Places Around Denham Springs
Baton Rouge, LA
Population 225,500
Baker, LA
Population 12,463
Merrydale, LA
Population 8,557
Central, LA
Population 29,518
Zachary, LA
Population 19,401
Gardere, LA
Population 11,565
Prairieville, LA
Population 34,215
Gonzales, LA
Population 12,356
Oak Hills Place, LA
Population 8,813
St. Gabriel, LA
Population 6,526
Denham Springs Demographics And Statistics
Population over time in Denham Springs
The current population in Denham Springs is 9,393. The population has decreased -8.1% from 2010.
| Year | Population | % Change |
|---|---|---|
| 2022 | 9,393 | -6.0% |
| 2021 | 9,991 | -0.7% |
| 2020 | 10,066 | -2.1% |
| 2019 | 10,278 | 1.5% |
| 2018 | 10,126 | -0.2% |
| 2017 | 10,148 | -0.4% |
| 2016 | 10,192 | -0.2% |
| 2015 | 10,212 | -0.7% |
| 2014 | 10,281 | 0.6% |
| 2013 | 10,222 | - |
Race / Ethnicity in Denham Springs
Denham Springs is:
75.3% White with 7,072 White residents.
12.7% African American with 1,191 African American residents.
0.0% American Indian with 0 American Indian residents.
0.0% Asian with 0 Asian residents.
0.0% Hawaiian with 0 Hawaiian residents.
0.0% Other with 0 Other residents.
2.7% Two Or More with 258 Two Or More residents.
9.3% Hispanic with 872 Hispanic residents.
| Race | Denham Springs | LA | USA |
|---|---|---|---|
| White | 75.3% | 57.5% | 58.9% |
| African American | 12.7% | 31.4% | 12.1% |
| American Indian | 0.0% | 0.4% | 0.6% |
| Asian | 0.0% | 1.7% | 5.7% |
| Hawaiian | 0.0% | 0.0% | 0.2% |
| Other | 0.0% | 0.4% | 0.4% |
| Two Or More | 2.7% | 3.0% | 3.5% |
| Hispanic | 9.3% | 5.5% | 18.7% |
Gender in Denham Springs
Denham Springs is 53.0% female with 4,974 female residents.
Denham Springs is 47.0% male with 4,419 male residents.
| Gender | Denham Springs | LA | USA |
|---|---|---|---|
| Female | 53.0% | 51.0% | 50.4% |
| Male | 47.0% | 49.0% | 49.6% |
Highest level of educational attainment in Denham Springs for adults over 25
1.0% of adults in Denham Springs completed < 9th grade.
3.0% of adults in Denham Springs completed 9-12th grade.
31.0% of adults in Denham Springs completed high school / ged.
29.0% of adults in Denham Springs completed some college.
7.0% of adults in Denham Springs completed associate's degree.
16.0% of adults in Denham Springs completed bachelor's degree.
12.0% of adults in Denham Springs completed master's degree.
0.0% of adults in Denham Springs completed professional degree.
1.0% of adults in Denham Springs completed doctorate degree.
| Education | Denham Springs | LA | USA |
|---|---|---|---|
| < 9th Grade | 1.0% | 3.0% | 4.0% |
| 9-12th Grade | 3.0% | 9.0% | 6.0% |
| High School / GED | 31.0% | 33.0% | 26.0% |
| Some College | 29.0% | 21.0% | 20.0% |
| Associate's Degree | 7.0% | 7.0% | 9.0% |
| Bachelor's Degree | 16.0% | 17.0% | 21.0% |
| Master's Degree | 12.0% | 7.0% | 10.0% |
| Professional Degree | 0.0% | 2.0% | 2.0% |
| Doctorate Degree | 1.0% | 1.0% | 2.0% |
Household Income For Denham Springs, Louisiana
3.7% of households in Denham Springs earn Less than $10,000.
1.5% of households in Denham Springs earn $10,000 to $14,999.
4.5% of households in Denham Springs earn $15,000 to $24,999.
9.4% of households in Denham Springs earn $25,000 to $34,999.
11.7% of households in Denham Springs earn $35,000 to $49,999.
12.5% of households in Denham Springs earn $50,000 to $74,999.
15.1% of households in Denham Springs earn $75,000 to $99,999.
25.9% of households in Denham Springs earn $100,000 to $149,999.
12.0% of households in Denham Springs earn $150,000 to $199,999.
3.6% of households in Denham Springs earn $200,000 or more.
| Income | Denham Springs | LA | USA |
|---|---|---|---|
| Less than $10,000 | 3.7% | 7.4% | 4.9% |
| $10,000 to $14,999 | 1.5% | 6.0% | 3.8% |
| $15,000 to $24,999 | 4.5% | 10.0% | 7.0% |
| $25,000 to $34,999 | 9.4% | 9.2% | 7.4% |
| $35,000 to $49,999 | 11.7% | 11.8% | 10.7% |
| $50,000 to $74,999 | 12.5% | 15.9% | 16.1% |
| $75,000 to $99,999 | 15.1% | 11.5% | 12.8% |
| $100,000 to $149,999 | 25.9% | 14.6% | 17.1% |
| $150,000 to $199,999 | 12.0% | 6.8% | 8.8% |
| $200,000 or more | 3.6% | 6.8% | 11.4% |


