Beverly, MA
Demographics And Statistics
Living In Beverly, Massachusetts Summary
Life in Beverly research summary. HomeSnacks has been using Saturday Night Science to research the quality of life in Beverly over the past nine years using Census, FBI, Zillow, and other primary data sources. Based on the most recently available data, we found the following about life in Beverly:
The population in Beverly is 42,414.
The median home value in Beverly is $671,453.
The median income in Beverly is $99,525.
The cost of living in Beverly is 136 which is 1.4x higher than the national average.
The median rent in Beverly is $1,622.
The unemployment rate in Beverly is 3.3%.
The poverty rate in Beverly is 10.5%.
The average high in Beverly is 58.0° and the average low is 40.9°.
Beverly SnackAbility
Overall SnackAbility
Beverly, MA Crime Report
Crime in Beverly summary. We use data from the FBI to determine the crime rates in Beverly. Key points include:
There were 249 total crimes in Beverly in the last reporting year.
The overall crime rate per 100,000 people in Beverly is 586.7 / 100k people.
The violent crime rate per 100,000 people in Beverly is 101.3 / 100k people.
The property crime rate per 100,000 people in Beverly is 485.4 / 100k people.
Overall, crime in Beverly is -74.76% below the national average.
Total Crimes
Below National Average
Crime In Beverly Comparison Table
| Statistic | Count Raw |
Beverly / 100k People |
Massachusetts / 100k People |
National / 100k People |
|---|---|---|---|---|
| Total Crimes Per 100K | 249 | 586.7 | 1,362.0 | 2,324.2 |
| Violent Crime | 43 | 101.3 | 308.8 | 369.8 |
| Murder | 0 | 0.0 | 2.3 | 6.3 |
| Robbery | 0 | 0.0 | 43.7 | 66.1 |
| Aggravated Assault | 38 | 89.5 | 235.9 | 268.2 |
| Property Crime | 206 | 485.4 | 1,053.2 | 1,954.4 |
| Burglary | 9 | 21.2 | 149.7 | 269.8 |
| Larceny | 185 | 435.9 | 804.3 | 1,401.9 |
| Car Theft | 12 | 28.3 | 99.2 | 282.7 |
Beverly, MA Cost Of Living
Cost of living in Beverly summary. We use data on the cost of living to determine how expensive it is to live in Beverly. Real estate prices drive most of the variance in cost of living around Massachusetts. Key points include:
The cost of living in Beverly is 136 with 100 being average.
The cost of living in Beverly is 1.4x higher than the national average.
The median home value in Beverly is $671,453.
The median income in Beverly is $99,525.
Beverly's Overall Cost Of Living
Higher Than The National Average
Cost Of Living In Beverly Comparison Table
| Living Expense | Beverly | Massachusetts | National Average | |
|---|---|---|---|---|
| Overall | 136 | 143 | 100 | |
| Services | 122 | 126 | 100 | |
| Groceries | 116 | 108 | 100 | |
| Health | 118 | 117 | 100 | |
| Housing | 178 | 202 | 100 | |
| Transportation | 127 | 114 | 100 | |
| Utilities | 126 | 123 | 100 | |
Beverly, MA Weather
The average high in Beverly is 58.0° and the average low is 40.9°.
There are 84.9 days of precipitation each year.
Expect an average of 46.7 inches of precipitation each year with 41.9 inches of snow.
| Stat | Beverly |
|---|---|
| Average Annual High | 58.0 |
| Average Annual Low | 40.9 |
| Annual Precipitation Days | 84.9 |
| Average Annual Precipitation | 46.7 |
| Average Annual Snowfall | 41.9 |
Average High
Days of Rain
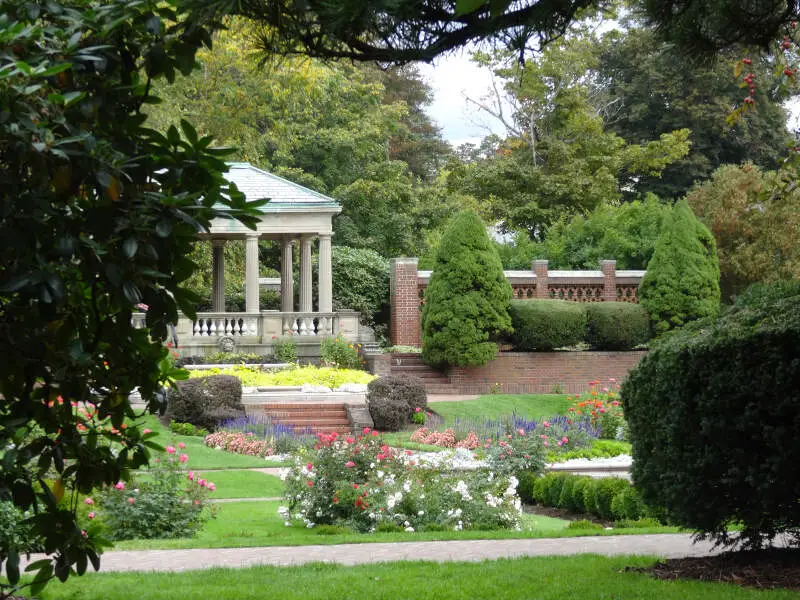
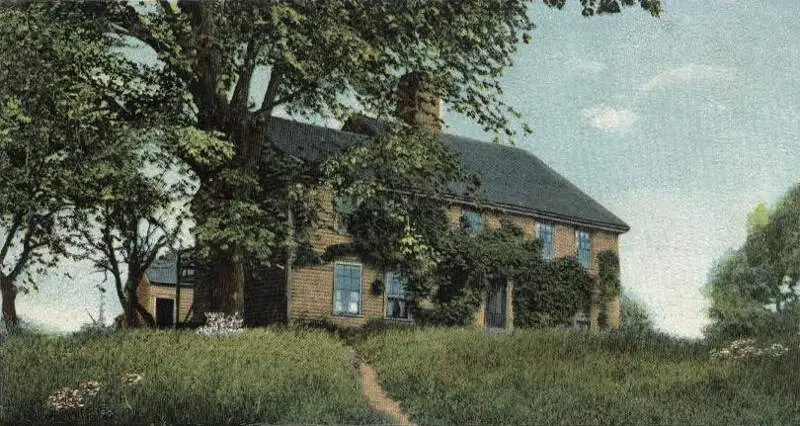
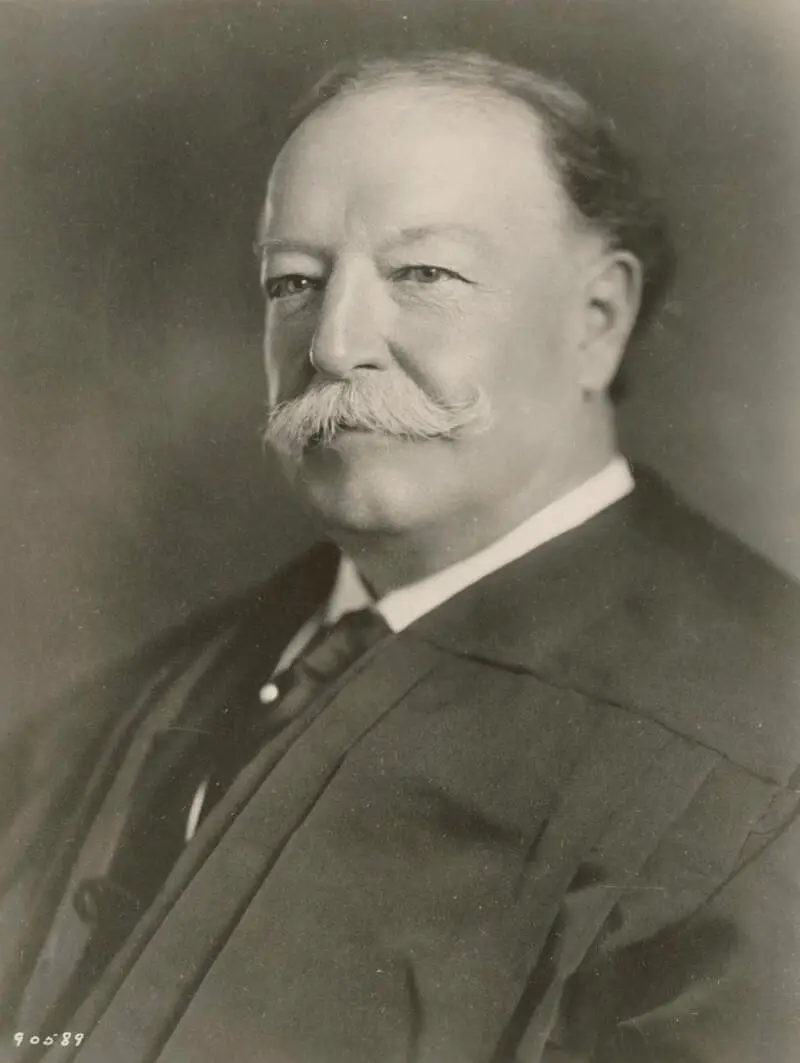
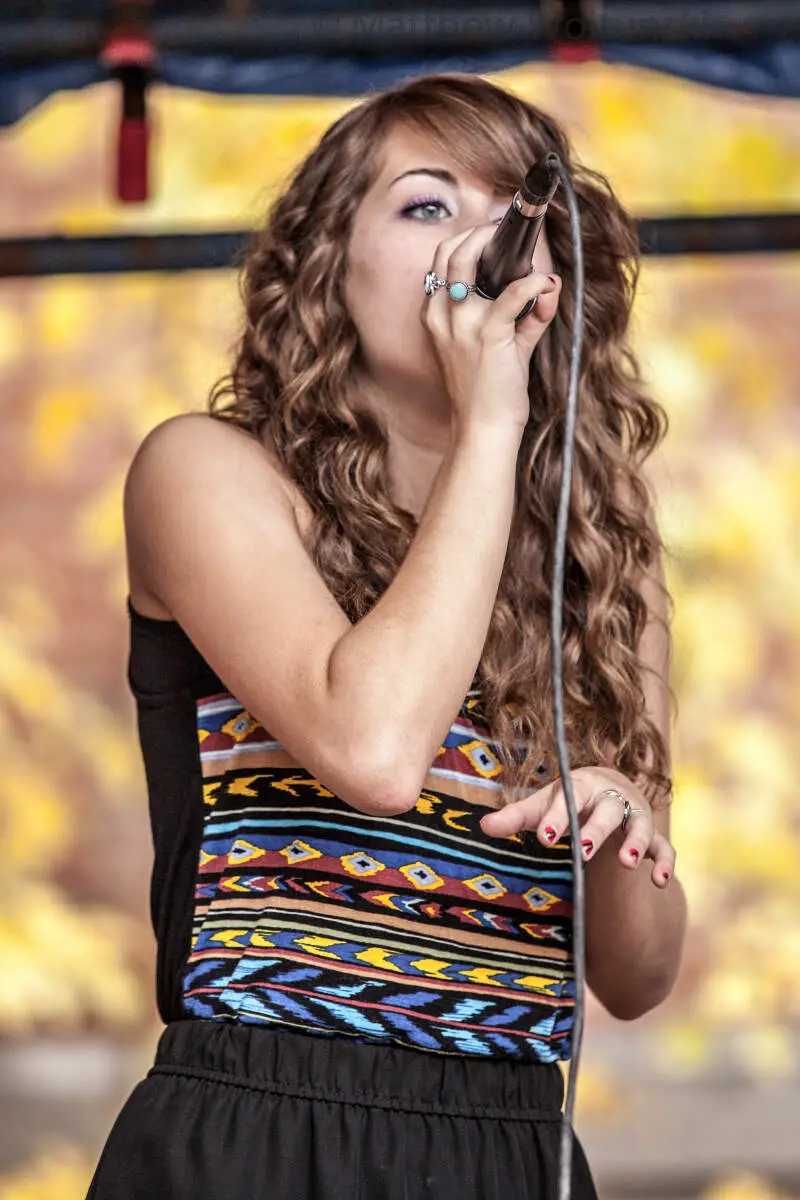
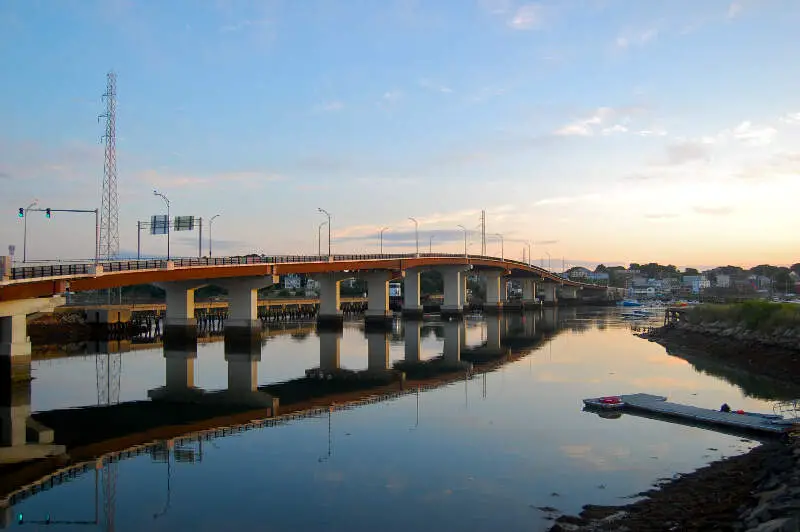
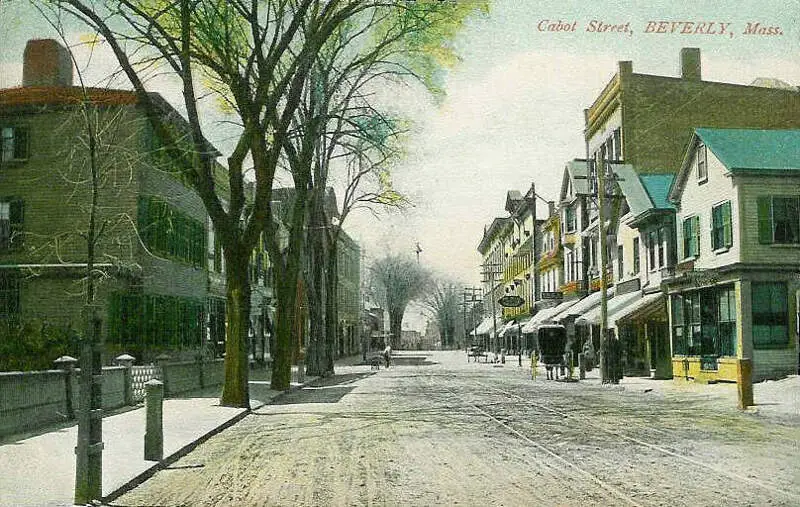
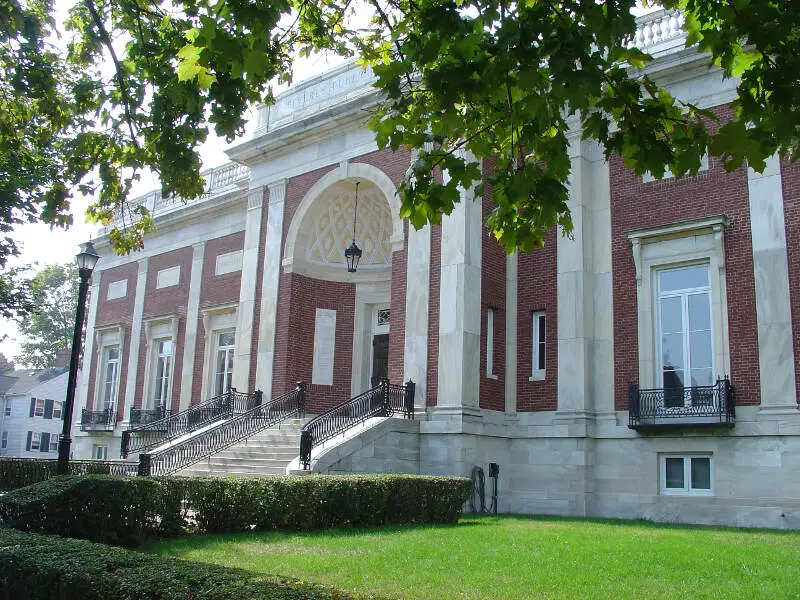
Beverly, MA Photos

Rankings for Beverly in Massachusetts


Locations Around Beverly
Map Of Beverly, MA
Best Places Around Beverly
Marblehead, MA
Population 20,350
Winchester, MA
Population 22,809
Reading, MA
Population 25,415
Pinehurst, MA
Population 6,426
Arlington, MA
Population 45,906
Melrose, MA
Population 29,477
Andover, MA
Population 9,419
Swampscott, MA
Population 15,125
Cambridge, MA
Population 117,962
Newburyport, MA
Population 18,356
Beverly Demographics And Statistics
Population over time in Beverly
The current population in Beverly is 42,414. The population has increased 7.8% from 2010.
| Year | Population | % Change |
|---|---|---|
| 2022 | 42,414 | 1.6% |
| 2021 | 41,731 | 0.7% |
| 2020 | 41,431 | 1.1% |
| 2019 | 40,967 | 0.7% |
| 2018 | 40,670 | 0.7% |
| 2017 | 40,370 | 0.9% |
| 2016 | 40,026 | 0.7% |
| 2015 | 39,748 | 0.7% |
| 2014 | 39,455 | 0.3% |
| 2013 | 39,351 | - |
Race / Ethnicity in Beverly
Beverly is:
84.9% White with 36,004 White residents.
2.4% African American with 1,006 African American residents.
0.1% American Indian with 32 American Indian residents.
2.1% Asian with 899 Asian residents.
0.0% Hawaiian with 5 Hawaiian residents.
0.4% Other with 182 Other residents.
3.6% Two Or More with 1,545 Two Or More residents.
6.5% Hispanic with 2,741 Hispanic residents.
| Race | Beverly | MA | USA |
|---|---|---|---|
| White | 84.9% | 68.9% | 58.9% |
| African American | 2.4% | 6.6% | 12.1% |
| American Indian | 0.1% | 0.1% | 0.6% |
| Asian | 2.1% | 6.9% | 5.7% |
| Hawaiian | 0.0% | 0.0% | 0.2% |
| Other | 0.4% | 1.0% | 0.4% |
| Two Or More | 3.6% | 3.9% | 3.5% |
| Hispanic | 6.5% | 12.6% | 18.7% |
Gender in Beverly
Beverly is 52.0% female with 22,053 female residents.
Beverly is 48.0% male with 20,361 male residents.
| Gender | Beverly | MA | USA |
|---|---|---|---|
| Female | 52.0% | 51.0% | 50.4% |
| Male | 48.0% | 49.0% | 49.6% |
Highest level of educational attainment in Beverly for adults over 25
1.0% of adults in Beverly completed < 9th grade.
2.0% of adults in Beverly completed 9-12th grade.
21.0% of adults in Beverly completed high school / ged.
13.0% of adults in Beverly completed some college.
10.0% of adults in Beverly completed associate's degree.
32.0% of adults in Beverly completed bachelor's degree.
16.0% of adults in Beverly completed master's degree.
3.0% of adults in Beverly completed professional degree.
2.0% of adults in Beverly completed doctorate degree.
| Education | Beverly | MA | USA |
|---|---|---|---|
| < 9th Grade | 1.0% | 3.0% | 4.0% |
| 9-12th Grade | 2.0% | 5.0% | 6.0% |
| High School / GED | 21.0% | 23.0% | 26.0% |
| Some College | 13.0% | 15.0% | 20.0% |
| Associate's Degree | 10.0% | 8.0% | 9.0% |
| Bachelor's Degree | 32.0% | 25.0% | 21.0% |
| Master's Degree | 16.0% | 15.0% | 10.0% |
| Professional Degree | 3.0% | 3.0% | 2.0% |
| Doctorate Degree | 2.0% | 3.0% | 2.0% |
Household Income For Beverly, Massachusetts
4.8% of households in Beverly earn Less than $10,000.
3.6% of households in Beverly earn $10,000 to $14,999.
7.7% of households in Beverly earn $15,000 to $24,999.
4.6% of households in Beverly earn $25,000 to $34,999.
5.8% of households in Beverly earn $35,000 to $49,999.
10.1% of households in Beverly earn $50,000 to $74,999.
13.5% of households in Beverly earn $75,000 to $99,999.
17.0% of households in Beverly earn $100,000 to $149,999.
11.3% of households in Beverly earn $150,000 to $199,999.
21.4% of households in Beverly earn $200,000 or more.
| Income | Beverly | MA | USA |
|---|---|---|---|
| Less than $10,000 | 4.8% | 4.4% | 4.9% |
| $10,000 to $14,999 | 3.6% | 3.7% | 3.8% |
| $15,000 to $24,999 | 7.7% | 5.9% | 7.0% |
| $25,000 to $34,999 | 4.6% | 5.6% | 7.4% |
| $35,000 to $49,999 | 5.8% | 7.8% | 10.7% |
| $50,000 to $74,999 | 10.1% | 12.7% | 16.1% |
| $75,000 to $99,999 | 13.5% | 11.3% | 12.8% |
| $100,000 to $149,999 | 17.0% | 17.7% | 17.1% |
| $150,000 to $199,999 | 11.3% | 11.6% | 8.8% |
| $200,000 or more | 21.4% | 19.3% | 11.4% |


