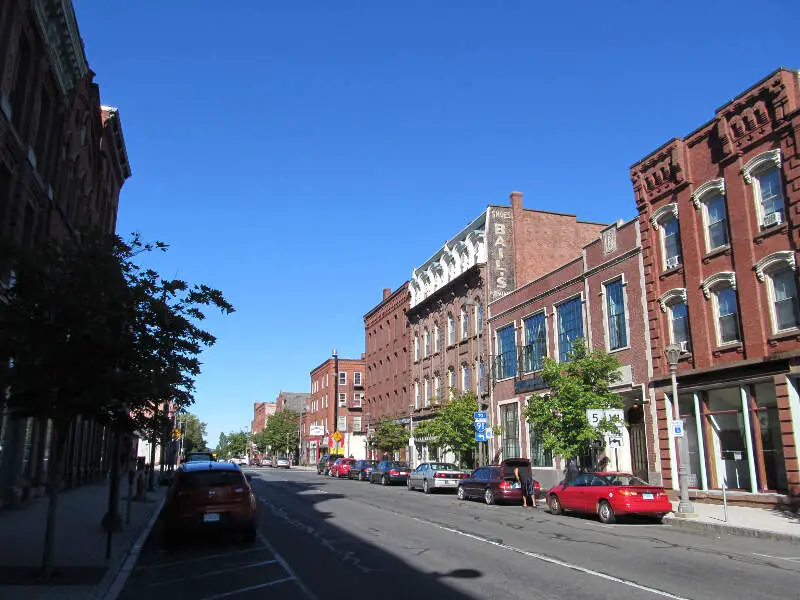
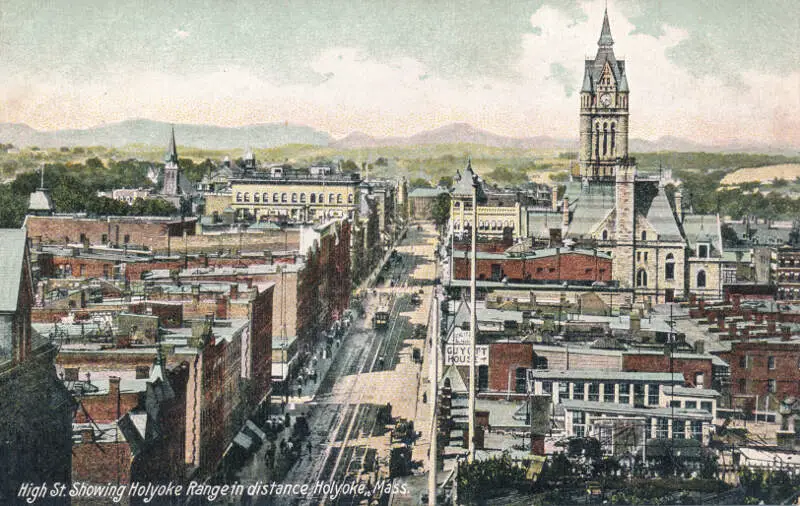
Holyoke, MA
Demographics And Statistics
Living In Holyoke, Massachusetts Summary
Life in Holyoke research summary. HomeSnacks has been using Saturday Night Science to research the quality of life in Holyoke over the past nine years using Census, FBI, Zillow, and other primary data sources. Based on the most recently available data, we found the following about life in Holyoke:
The population in Holyoke is 38,210.
The median home value in Holyoke is $291,473.
The median income in Holyoke is $49,007.
The cost of living in Holyoke is 104 which is 1.0x higher than the national average.
The median rent in Holyoke is $937.
The unemployment rate in Holyoke is 6.8%.
The poverty rate in Holyoke is 26.0%.
The average high in Holyoke is 59.8° and the average low is 38.8°.
Holyoke SnackAbility
Overall SnackAbility
Holyoke, MA Crime Report
Crime in Holyoke summary. We use data from the FBI to determine the crime rates in Holyoke. Key points include:
There were 1,775 total crimes in Holyoke in the last reporting year.
The overall crime rate per 100,000 people in Holyoke is 4,677.8 / 100k people.
The violent crime rate per 100,000 people in Holyoke is 959.3 / 100k people.
The property crime rate per 100,000 people in Holyoke is 3,718.5 / 100k people.
Overall, crime in Holyoke is 101.27% above the national average.
Total Crimes
Above National Average
Crime In Holyoke Comparison Table
| Statistic | Count Raw |
Holyoke / 100k People |
Massachusetts / 100k People |
National / 100k People |
|---|---|---|---|---|
| Total Crimes Per 100K | 1,775 | 4,677.8 | 1,362.0 | 2,324.2 |
| Violent Crime | 364 | 959.3 | 308.8 | 369.8 |
| Murder | 6 | 15.8 | 2.3 | 6.3 |
| Robbery | 57 | 150.2 | 43.7 | 66.1 |
| Aggravated Assault | 290 | 764.3 | 235.9 | 268.2 |
| Property Crime | 1,411 | 3,718.5 | 1,053.2 | 1,954.4 |
| Burglary | 132 | 347.9 | 149.7 | 269.8 |
| Larceny | 1,161 | 3,059.7 | 804.3 | 1,401.9 |
| Car Theft | 118 | 311.0 | 99.2 | 282.7 |
Holyoke, MA Cost Of Living
Cost of living in Holyoke summary. We use data on the cost of living to determine how expensive it is to live in Holyoke. Real estate prices drive most of the variance in cost of living around Massachusetts. Key points include:
The cost of living in Holyoke is 104 with 100 being average.
The cost of living in Holyoke is 1.0x higher than the national average.
The median home value in Holyoke is $291,473.
The median income in Holyoke is $49,007.
Holyoke's Overall Cost Of Living
Higher Than The National Average
Cost Of Living In Holyoke Comparison Table
| Living Expense | Holyoke | Massachusetts | National Average | |
|---|---|---|---|---|
| Overall | 104 | 143 | 100 | |
| Services | 113 | 126 | 100 | |
| Groceries | 103 | 108 | 100 | |
| Health | 93 | 117 | 100 | |
| Housing | 94 | 202 | 100 | |
| Transportation | 107 | 114 | 100 | |
| Utilities | 124 | 123 | 100 | |
Holyoke, MA Weather
The average high in Holyoke is 59.8° and the average low is 38.8°.
There are 70.8 days of precipitation each year.
Expect an average of 45.4 inches of precipitation each year with 40.0 inches of snow.
| Stat | Holyoke |
|---|---|
| Average Annual High | 59.8 |
| Average Annual Low | 38.8 |
| Annual Precipitation Days | 70.8 |
| Average Annual Precipitation | 45.4 |
| Average Annual Snowfall | 40.0 |
Average High
Days of Rain
Holyoke, MA Photos
2 Reviews & Comments About Holyoke
/5

Josh of all trades Gendron -
At one time holyoke had more billionaires per capita out of the entire united states.
Now it has the best h****n dealers and best h****n prices in the nation. Ok now on a serious note ive been in all these citys i live in chicopee and at a low time in my life was homeless living in holyoke and springfield with a massive drug problem.
Ive been shot ive been stabbed and ive been in the worst of what these citys have. Im proud i rebuilt my life 6 years sober.
Own my own buisness and have a wonderful family. But everyday is a grim reminder when i bounce from holyoke springfield each day for jobs.
Thank goodness i live in chicopee.
HomeSnacks User -
Years ago Holyoke was bad, but tor the past 10 years the ghetto n the crime has extremely decreased!! Last 2 years there were no deaths on crime at all and this year 2 and the ones that did the crime were already caught.
Rankings for Holyoke in Massachusetts


Locations Around Holyoke
Map Of Holyoke, MA
Best Places Around Holyoke
Sherwood Manor, CT
Population 5,731
Southwood Acres, CT
Population 7,928
Windsor Locks, CT
Population 12,563
Hazardville, CT
Population 6,123
Longmeadow, MA
Population 15,789
West Springfield, VA
Population 23,372
Holyoke Demographics And Statistics
Population over time in Holyoke
The current population in Holyoke is 38,210. The population has decreased -4.2% from 2010.
| Year | Population | % Change |
|---|---|---|
| 2022 | 38,210 | -5.4% |
| 2021 | 40,376 | 0.0% |
| 2020 | 40,362 | 0.2% |
| 2019 | 40,280 | -0.2% |
| 2018 | 40,342 | 0.7% |
| 2017 | 40,079 | 0.1% |
| 2016 | 40,029 | 0.1% |
| 2015 | 39,996 | 0.2% |
| 2014 | 39,897 | 0.0% |
| 2013 | 39,885 | - |
Race / Ethnicity in Holyoke
Holyoke is:
43.3% White with 16,555 White residents.
2.6% African American with 997 African American residents.
0.1% American Indian with 34 American Indian residents.
0.6% Asian with 242 Asian residents.
0.0% Hawaiian with 0 Hawaiian residents.
0.1% Other with 30 Other residents.
1.6% Two Or More with 608 Two Or More residents.
51.7% Hispanic with 19,744 Hispanic residents.
| Race | Holyoke | MA | USA |
|---|---|---|---|
| White | 43.3% | 68.9% | 58.9% |
| African American | 2.6% | 6.6% | 12.1% |
| American Indian | 0.1% | 0.1% | 0.6% |
| Asian | 0.6% | 6.9% | 5.7% |
| Hawaiian | 0.0% | 0.0% | 0.2% |
| Other | 0.1% | 1.0% | 0.4% |
| Two Or More | 1.6% | 3.9% | 3.5% |
| Hispanic | 51.7% | 12.6% | 18.7% |
Gender in Holyoke
Holyoke is 50.8% female with 19,405 female residents.
Holyoke is 49.2% male with 18,805 male residents.
| Gender | Holyoke | MA | USA |
|---|---|---|---|
| Female | 50.8% | 51.0% | 50.4% |
| Male | 49.2% | 49.0% | 49.6% |
Highest level of educational attainment in Holyoke for adults over 25
9.0% of adults in Holyoke completed < 9th grade.
13.0% of adults in Holyoke completed 9-12th grade.
31.0% of adults in Holyoke completed high school / ged.
16.0% of adults in Holyoke completed some college.
9.0% of adults in Holyoke completed associate's degree.
14.0% of adults in Holyoke completed bachelor's degree.
6.0% of adults in Holyoke completed master's degree.
1.0% of adults in Holyoke completed professional degree.
1.0% of adults in Holyoke completed doctorate degree.
| Education | Holyoke | MA | USA |
|---|---|---|---|
| < 9th Grade | 9.0% | 3.0% | 4.0% |
| 9-12th Grade | 13.0% | 5.0% | 6.0% |
| High School / GED | 31.0% | 23.0% | 26.0% |
| Some College | 16.0% | 15.0% | 20.0% |
| Associate's Degree | 9.0% | 8.0% | 9.0% |
| Bachelor's Degree | 14.0% | 25.0% | 21.0% |
| Master's Degree | 6.0% | 15.0% | 10.0% |
| Professional Degree | 1.0% | 3.0% | 2.0% |
| Doctorate Degree | 1.0% | 3.0% | 2.0% |
Household Income For Holyoke, Massachusetts
9.0% of households in Holyoke earn Less than $10,000.
9.3% of households in Holyoke earn $10,000 to $14,999.
11.3% of households in Holyoke earn $15,000 to $24,999.
7.9% of households in Holyoke earn $25,000 to $34,999.
13.6% of households in Holyoke earn $35,000 to $49,999.
16.8% of households in Holyoke earn $50,000 to $74,999.
11.7% of households in Holyoke earn $75,000 to $99,999.
9.4% of households in Holyoke earn $100,000 to $149,999.
5.9% of households in Holyoke earn $150,000 to $199,999.
5.1% of households in Holyoke earn $200,000 or more.
| Income | Holyoke | MA | USA |
|---|---|---|---|
| Less than $10,000 | 9.0% | 4.4% | 4.9% |
| $10,000 to $14,999 | 9.3% | 3.7% | 3.8% |
| $15,000 to $24,999 | 11.3% | 5.9% | 7.0% |
| $25,000 to $34,999 | 7.9% | 5.6% | 7.4% |
| $35,000 to $49,999 | 13.6% | 7.8% | 10.7% |
| $50,000 to $74,999 | 16.8% | 12.7% | 16.1% |
| $75,000 to $99,999 | 11.7% | 11.3% | 12.8% |
| $100,000 to $149,999 | 9.4% | 17.7% | 17.1% |
| $150,000 to $199,999 | 5.9% | 11.6% | 8.8% |
| $200,000 or more | 5.1% | 19.3% | 11.4% |


