Quincy, MA
Demographics And Statistics
Living In Quincy, Massachusetts Summary
Life in Quincy research summary. HomeSnacks has been using Saturday Night Science to research the quality of life in Quincy over the past nine years using Census, FBI, Zillow, and other primary data sources. Based on the most recently available data, we found the following about life in Quincy:
The population in Quincy is 100,981.
The median home value in Quincy is $617,826.
The median income in Quincy is $90,668.
The cost of living in Quincy is 138 which is 1.4x higher than the national average.
The median rent in Quincy is $1,901.
The unemployment rate in Quincy is 6.7%.
The poverty rate in Quincy is 11.2%.
The average high in Quincy is 59.5° and the average low is 42.0°.
Quincy SnackAbility
Overall SnackAbility
Quincy, MA Crime Report
Crime in Quincy summary. We use data from the FBI to determine the crime rates in Quincy. Key points include:
There were 1,509 total crimes in Quincy in the last reporting year.
The overall crime rate per 100,000 people in Quincy is 1,487.7 / 100k people.
The violent crime rate per 100,000 people in Quincy is 397.3 / 100k people.
The property crime rate per 100,000 people in Quincy is 1,090.4 / 100k people.
Overall, crime in Quincy is -35.99% below the national average.
Total Crimes
Below National Average
Crime In Quincy Comparison Table
| Statistic | Count Raw |
Quincy / 100k People |
Massachusetts / 100k People |
National / 100k People |
|---|---|---|---|---|
| Total Crimes Per 100K | 1,509 | 1,487.7 | 1,362.0 | 2,324.2 |
| Violent Crime | 403 | 397.3 | 308.8 | 369.8 |
| Murder | 2 | 2.0 | 2.3 | 6.3 |
| Robbery | 32 | 31.5 | 43.7 | 66.1 |
| Aggravated Assault | 335 | 330.3 | 235.9 | 268.2 |
| Property Crime | 1,106 | 1,090.4 | 1,053.2 | 1,954.4 |
| Burglary | 198 | 195.2 | 149.7 | 269.8 |
| Larceny | 816 | 804.5 | 804.3 | 1,401.9 |
| Car Theft | 92 | 90.7 | 99.2 | 282.7 |
Quincy, MA Cost Of Living
Cost of living in Quincy summary. We use data on the cost of living to determine how expensive it is to live in Quincy. Real estate prices drive most of the variance in cost of living around Massachusetts. Key points include:
The cost of living in Quincy is 138 with 100 being average.
The cost of living in Quincy is 1.4x higher than the national average.
The median home value in Quincy is $617,826.
The median income in Quincy is $90,668.
Quincy's Overall Cost Of Living
Higher Than The National Average
Cost Of Living In Quincy Comparison Table
| Living Expense | Quincy | Massachusetts | National Average | |
|---|---|---|---|---|
| Overall | 138 | 143 | 100 | |
| Services | 120 | 126 | 100 | |
| Groceries | 114 | 108 | 100 | |
| Health | 119 | 117 | 100 | |
| Housing | 181 | 202 | 100 | |
| Transportation | 126 | 114 | 100 | |
| Utilities | 126 | 123 | 100 | |
Quincy, MA Weather
The average high in Quincy is 59.5° and the average low is 42.0°.
There are 78.3 days of precipitation each year.
Expect an average of 49.7 inches of precipitation each year with 48.9 inches of snow.
| Stat | Quincy |
|---|---|
| Average Annual High | 59.5 |
| Average Annual Low | 42.0 |
| Annual Precipitation Days | 78.3 |
| Average Annual Precipitation | 49.7 |
| Average Annual Snowfall | 48.9 |
Average High
Days of Rain
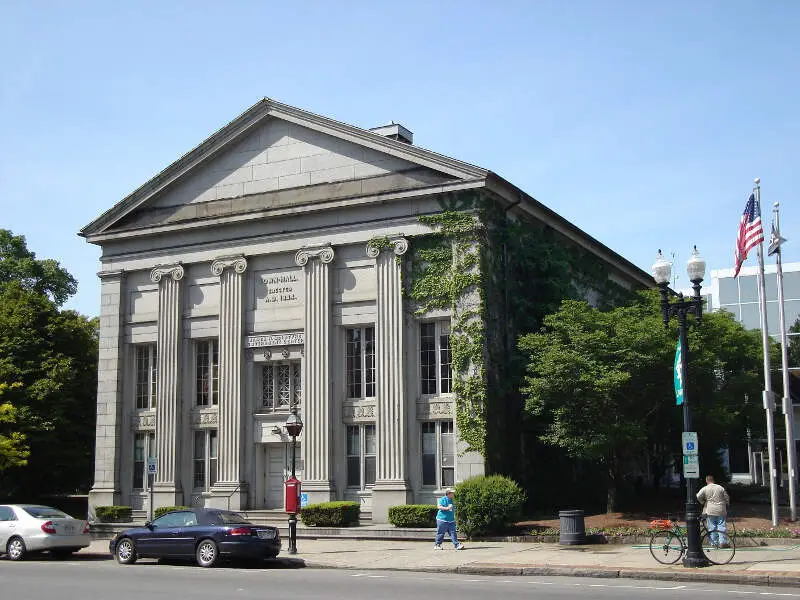
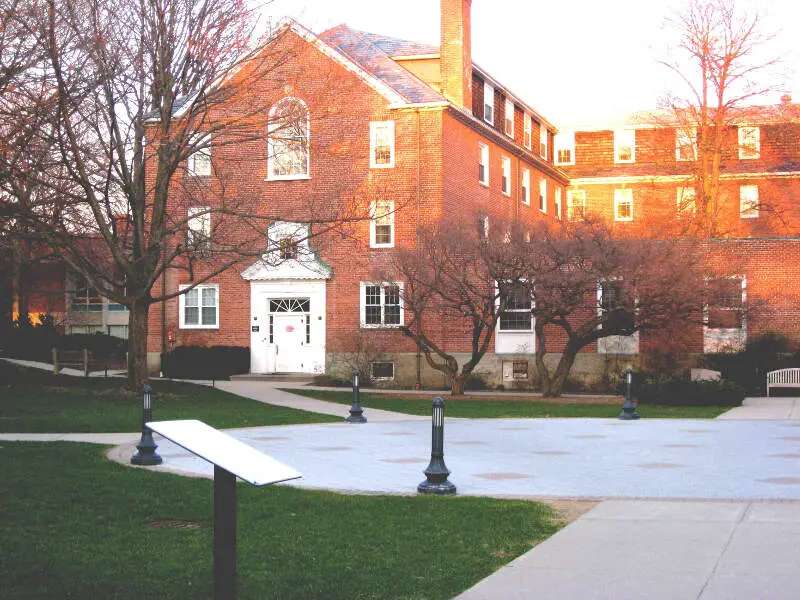
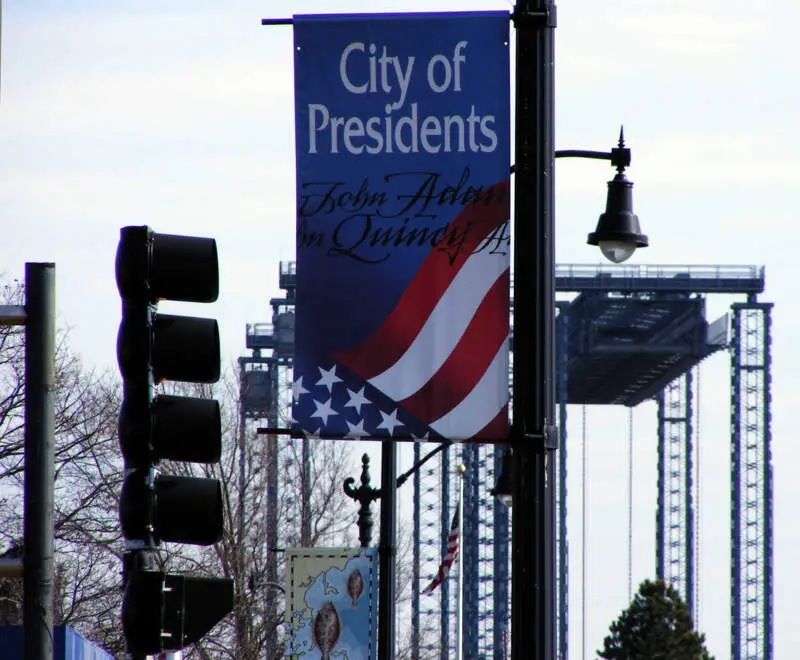
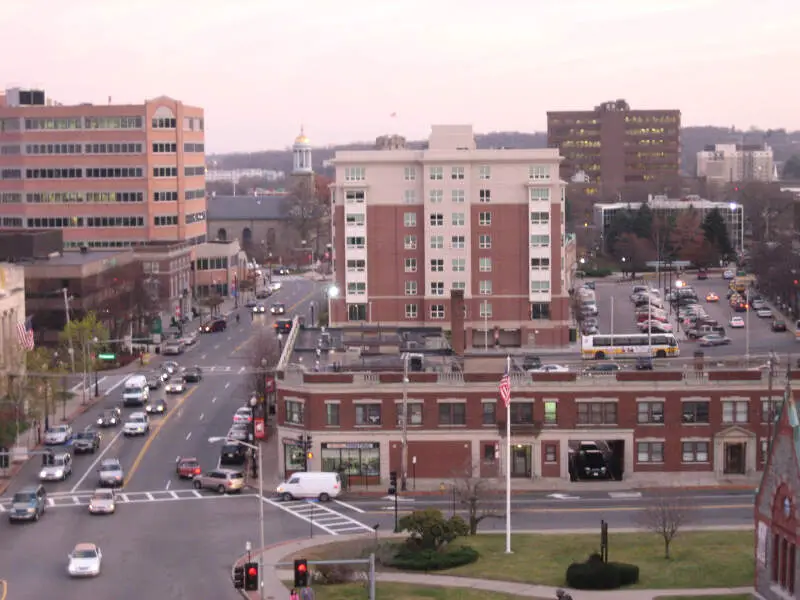
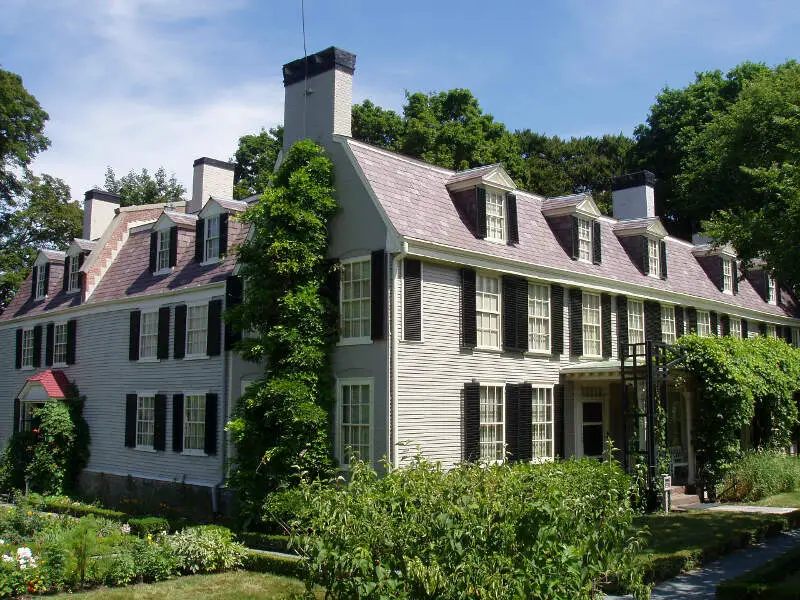
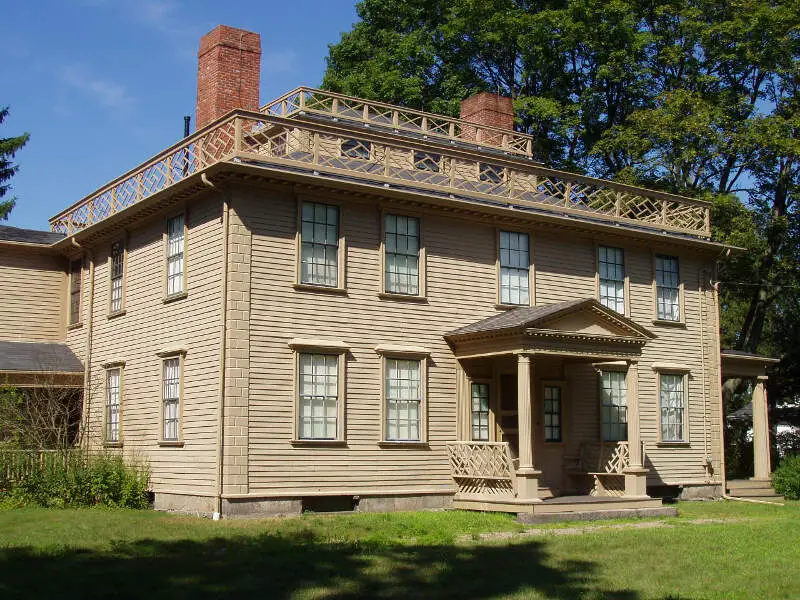
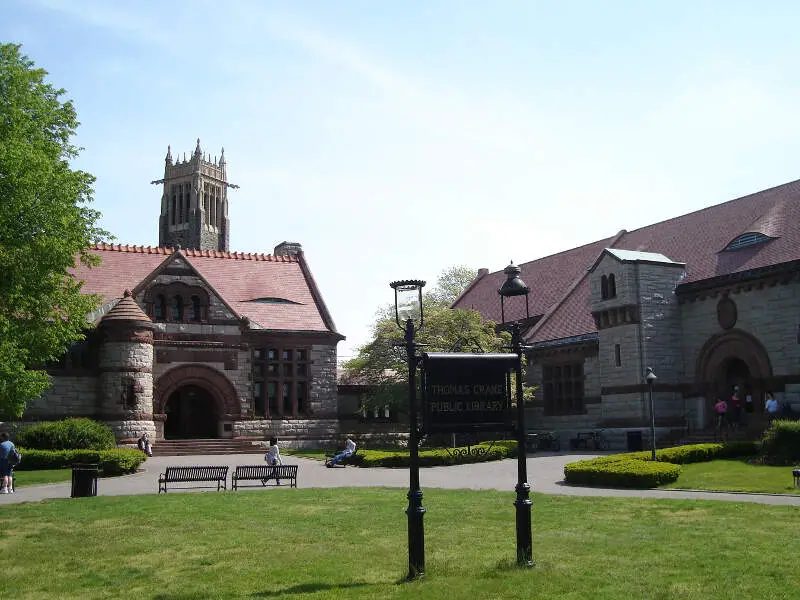
Quincy, MA Photos


Rankings for Quincy in Massachusetts


Locations Around Quincy
Map Of Quincy, MA
Best Places Around Quincy
Lexington, MA
Population 34,221
Wellesley, MA
Population 29,862
Marblehead, MA
Population 20,350
Sharon, MA
Population 5,983
Needham, MA
Population 31,957
Newton, MA
Population 88,453
Winchester, MA
Population 22,809
Reading, MA
Population 25,415
Cochituate, MA
Population 6,937
Brookline, MA
Population 62,698
Quincy Demographics And Statistics
Population over time in Quincy
The current population in Quincy is 100,981. The population has increased 11.2% from 2010.
| Year | Population | % Change |
|---|---|---|
| 2022 | 100,981 | 7.3% |
| 2021 | 94,121 | 0.3% |
| 2020 | 93,824 | 0.5% |
| 2019 | 93,349 | 0.2% |
| 2018 | 93,177 | 0.3% |
| 2017 | 92,920 | 0.4% |
| 2016 | 92,595 | 0.6% |
| 2015 | 92,078 | 0.6% |
| 2014 | 91,484 | 0.8% |
| 2013 | 90,780 | - |
Race / Ethnicity in Quincy
Quincy is:
56.2% White with 56,708 White residents.
6.0% African American with 6,097 African American residents.
0.1% American Indian with 87 American Indian residents.
28.8% Asian with 29,043 Asian residents.
0.1% Hawaiian with 63 Hawaiian residents.
0.7% Other with 667 Other residents.
2.8% Two Or More with 2,876 Two Or More residents.
5.4% Hispanic with 5,440 Hispanic residents.
| Race | Quincy | MA | USA |
|---|---|---|---|
| White | 56.2% | 68.9% | 58.9% |
| African American | 6.0% | 6.6% | 12.1% |
| American Indian | 0.1% | 0.1% | 0.6% |
| Asian | 28.8% | 6.9% | 5.7% |
| Hawaiian | 0.1% | 0.0% | 0.2% |
| Other | 0.7% | 1.0% | 0.4% |
| Two Or More | 2.8% | 3.9% | 3.5% |
| Hispanic | 5.4% | 12.6% | 18.7% |
Gender in Quincy
Quincy is 49.5% female with 49,979 female residents.
Quincy is 50.5% male with 51,001 male residents.
| Gender | Quincy | MA | USA |
|---|---|---|---|
| Female | 49.5% | 51.0% | 50.4% |
| Male | 50.5% | 49.0% | 49.6% |
Highest level of educational attainment in Quincy for adults over 25
7.0% of adults in Quincy completed < 9th grade.
5.0% of adults in Quincy completed 9-12th grade.
21.0% of adults in Quincy completed high school / ged.
14.0% of adults in Quincy completed some college.
7.0% of adults in Quincy completed associate's degree.
27.0% of adults in Quincy completed bachelor's degree.
15.0% of adults in Quincy completed master's degree.
2.0% of adults in Quincy completed professional degree.
2.0% of adults in Quincy completed doctorate degree.
| Education | Quincy | MA | USA |
|---|---|---|---|
| < 9th Grade | 7.0% | 3.0% | 4.0% |
| 9-12th Grade | 5.0% | 5.0% | 6.0% |
| High School / GED | 21.0% | 23.0% | 26.0% |
| Some College | 14.0% | 15.0% | 20.0% |
| Associate's Degree | 7.0% | 8.0% | 9.0% |
| Bachelor's Degree | 27.0% | 25.0% | 21.0% |
| Master's Degree | 15.0% | 15.0% | 10.0% |
| Professional Degree | 2.0% | 3.0% | 2.0% |
| Doctorate Degree | 2.0% | 3.0% | 2.0% |
Household Income For Quincy, Massachusetts
4.9% of households in Quincy earn Less than $10,000.
3.4% of households in Quincy earn $10,000 to $14,999.
5.7% of households in Quincy earn $15,000 to $24,999.
6.1% of households in Quincy earn $25,000 to $34,999.
7.6% of households in Quincy earn $35,000 to $49,999.
13.8% of households in Quincy earn $50,000 to $74,999.
13.3% of households in Quincy earn $75,000 to $99,999.
19.7% of households in Quincy earn $100,000 to $149,999.
11.7% of households in Quincy earn $150,000 to $199,999.
13.7% of households in Quincy earn $200,000 or more.
| Income | Quincy | MA | USA |
|---|---|---|---|
| Less than $10,000 | 4.9% | 4.4% | 4.9% |
| $10,000 to $14,999 | 3.4% | 3.7% | 3.8% |
| $15,000 to $24,999 | 5.7% | 5.9% | 7.0% |
| $25,000 to $34,999 | 6.1% | 5.6% | 7.4% |
| $35,000 to $49,999 | 7.6% | 7.8% | 10.7% |
| $50,000 to $74,999 | 13.8% | 12.7% | 16.1% |
| $75,000 to $99,999 | 13.3% | 11.3% | 12.8% |
| $100,000 to $149,999 | 19.7% | 17.7% | 17.1% |
| $150,000 to $199,999 | 11.7% | 11.6% | 8.8% |
| $200,000 or more | 13.7% | 19.3% | 11.4% |


