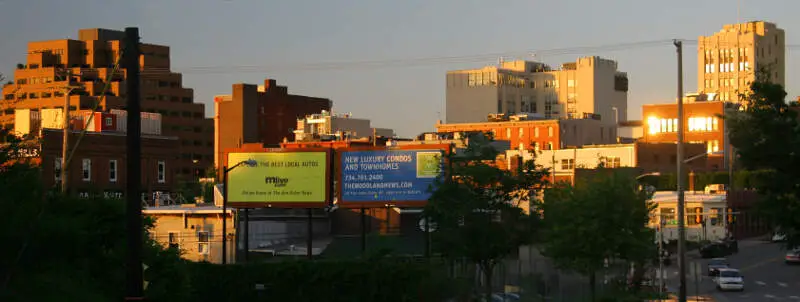
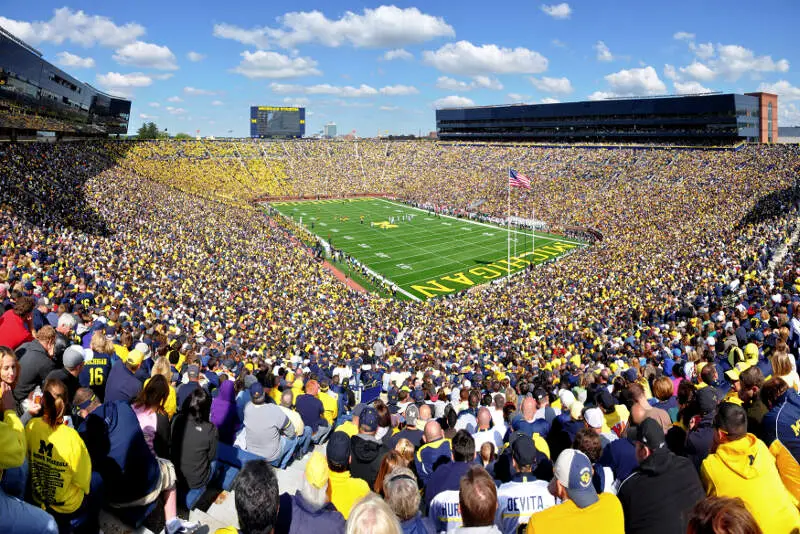
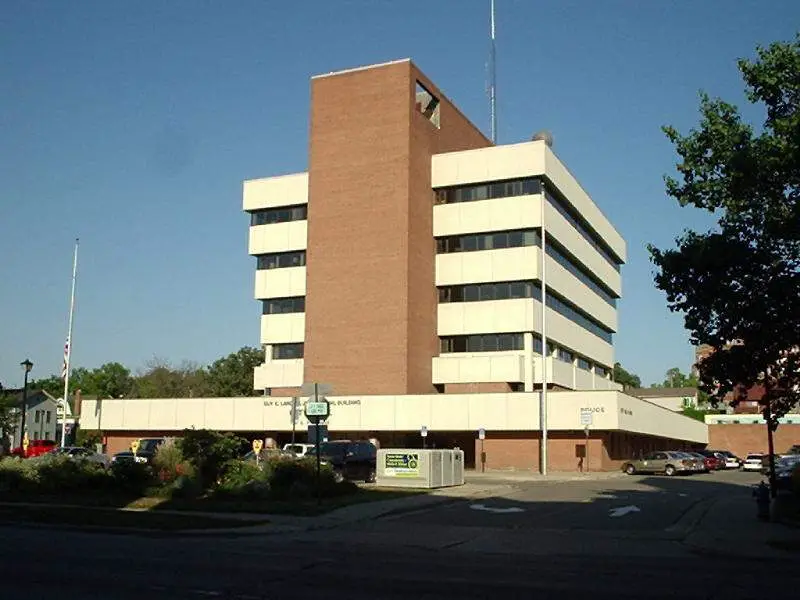
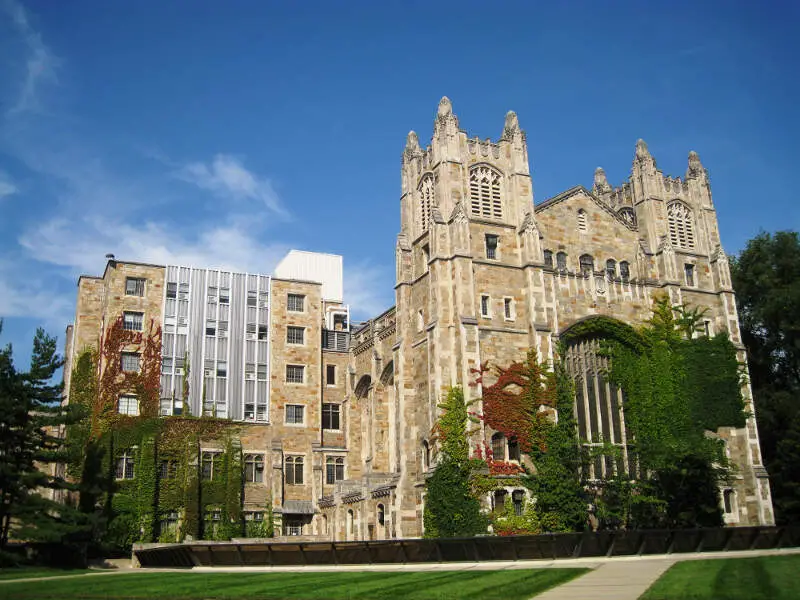
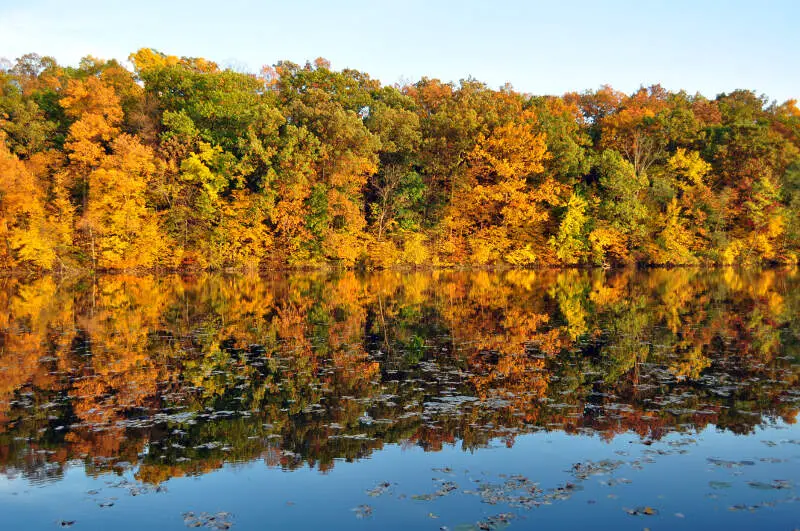
Ann Arbor, MI
Demographics And Statistics
Living In Ann Arbor, Michigan Summary
Life in Ann Arbor research summary. HomeSnacks has been using Saturday Night Science to research the quality of life in Ann Arbor over the past nine years using Census, FBI, Zillow, and other primary data sources. Based on the most recently available data, we found the following about life in Ann Arbor:
The population in Ann Arbor is 122,216.
The median home value in Ann Arbor is $479,804.
The median income in Ann Arbor is $78,546.
The cost of living in Ann Arbor is 112 which is 1.1x higher than the national average.
The median rent in Ann Arbor is $1,472.
The unemployment rate in Ann Arbor is 3.7%.
The poverty rate in Ann Arbor is 23.3%.
The average high in Ann Arbor is 58.6° and the average low is 38.4°.
Ann Arbor SnackAbility
Overall SnackAbility
Ann Arbor, MI Crime Report
Crime in Ann Arbor summary. We use data from the FBI to determine the crime rates in Ann Arbor. Key points include:
There were 2,440 total crimes in Ann Arbor in the last reporting year.
The overall crime rate per 100,000 people in Ann Arbor is 2,024.1 / 100k people.
The violent crime rate per 100,000 people in Ann Arbor is 307.8 / 100k people.
The property crime rate per 100,000 people in Ann Arbor is 1,716.3 / 100k people.
Overall, crime in Ann Arbor is -12.91% below the national average.
Total Crimes
Below National Average
Crime In Ann Arbor Comparison Table
| Statistic | Count Raw |
Ann Arbor / 100k People |
Michigan / 100k People |
National / 100k People |
|---|---|---|---|---|
| Total Crimes Per 100K | 2,440 | 2,024.1 | 1,838.9 | 2,324.2 |
| Violent Crime | 371 | 307.8 | 478.0 | 369.8 |
| Murder | 1 | 0.8 | 7.6 | 6.3 |
| Robbery | 39 | 32.4 | 44.5 | 66.1 |
| Aggravated Assault | 282 | 233.9 | 365.1 | 268.2 |
| Property Crime | 2,069 | 1,716.3 | 1,360.9 | 1,954.4 |
| Burglary | 259 | 214.9 | 233.1 | 269.8 |
| Larceny | 1,662 | 1,378.7 | 943.3 | 1,401.9 |
| Car Theft | 148 | 122.8 | 184.5 | 282.7 |
Ann Arbor, MI Cost Of Living
Cost of living in Ann Arbor summary. We use data on the cost of living to determine how expensive it is to live in Ann Arbor. Real estate prices drive most of the variance in cost of living around Michigan. Key points include:
The cost of living in Ann Arbor is 112 with 100 being average.
The cost of living in Ann Arbor is 1.1x higher than the national average.
The median home value in Ann Arbor is $479,804.
The median income in Ann Arbor is $78,546.
Ann Arbor's Overall Cost Of Living
Higher Than The National Average
Cost Of Living In Ann Arbor Comparison Table
| Living Expense | Ann Arbor | Michigan | National Average | |
|---|---|---|---|---|
| Overall | 112 | 92 | 100 | |
| Services | 106 | 96 | 100 | |
| Groceries | 99 | 96 | 100 | |
| Health | 100 | 94 | 100 | |
| Housing | 130 | 80 | 100 | |
| Transportation | 102 | 97 | 100 | |
| Utilities | 99 | 100 | 100 | |
Ann Arbor, MI Weather
The average high in Ann Arbor is 58.6° and the average low is 38.4°.
There are 81.6 days of precipitation each year.
Expect an average of 35.9 inches of precipitation each year with 52.8 inches of snow.
| Stat | Ann Arbor |
|---|---|
| Average Annual High | 58.6 |
| Average Annual Low | 38.4 |
| Annual Precipitation Days | 81.6 |
| Average Annual Precipitation | 35.9 |
| Average Annual Snowfall | 52.8 |
Average High
Days of Rain
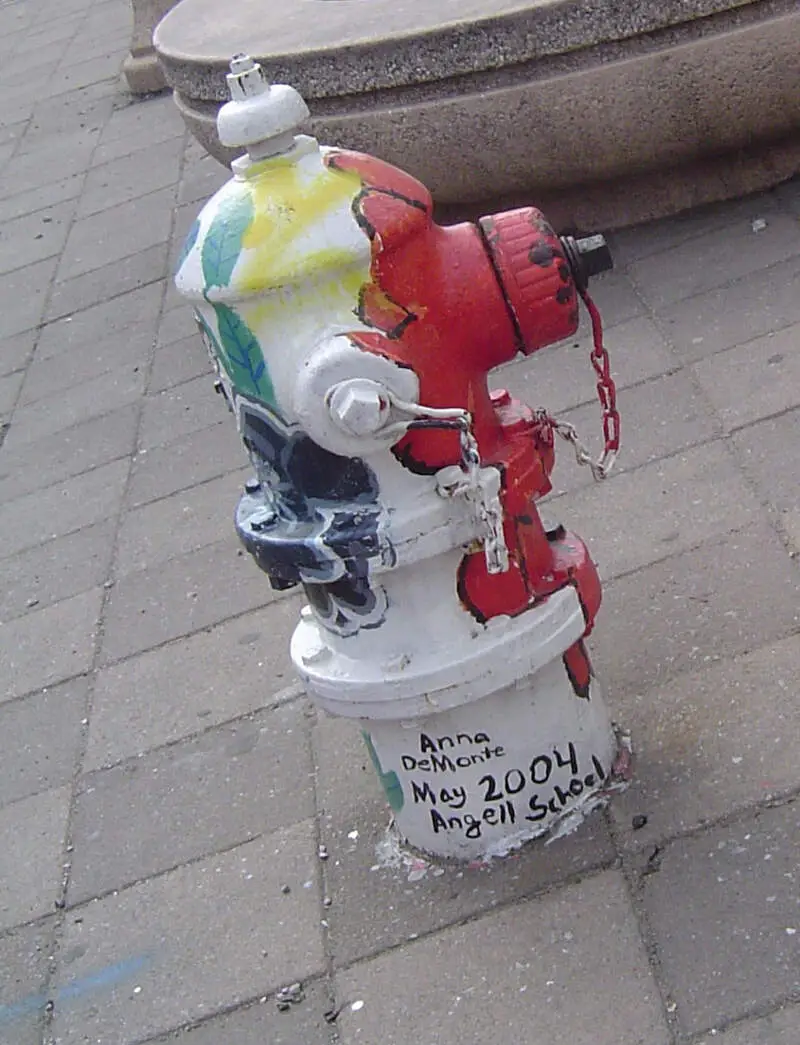
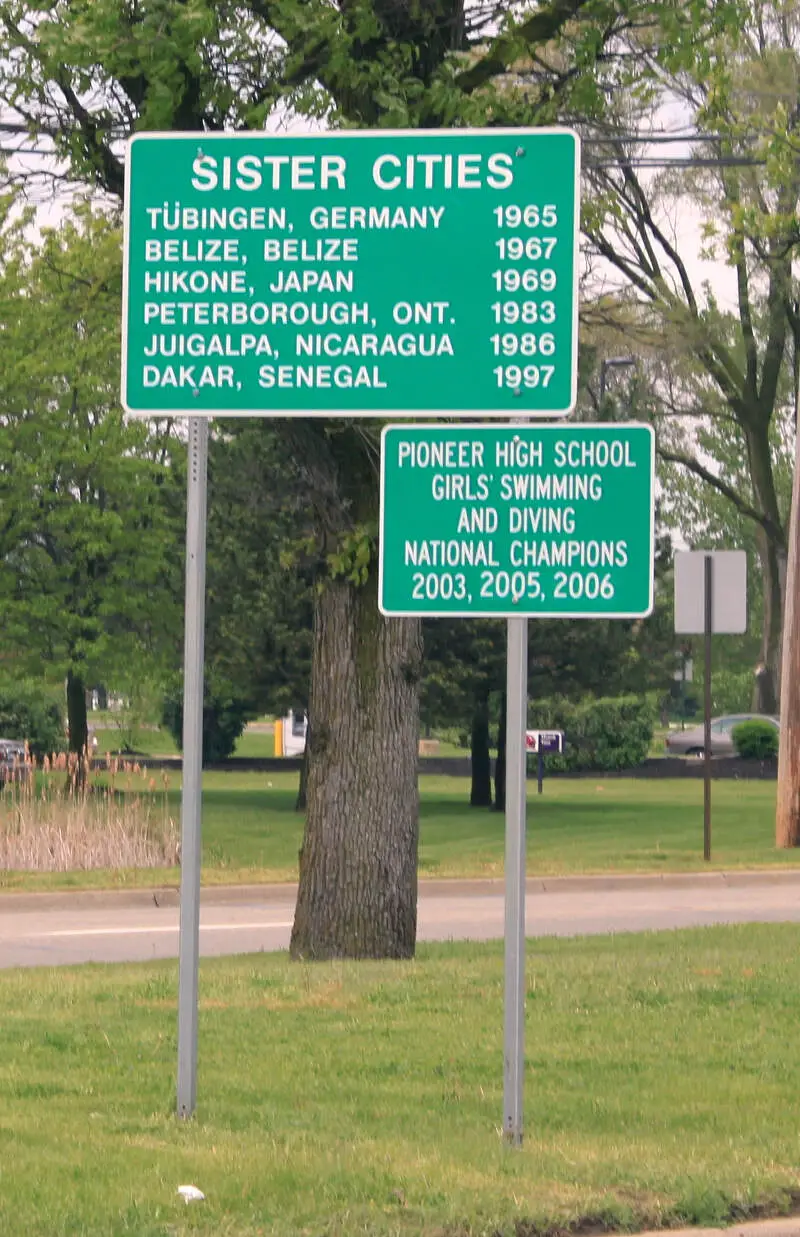
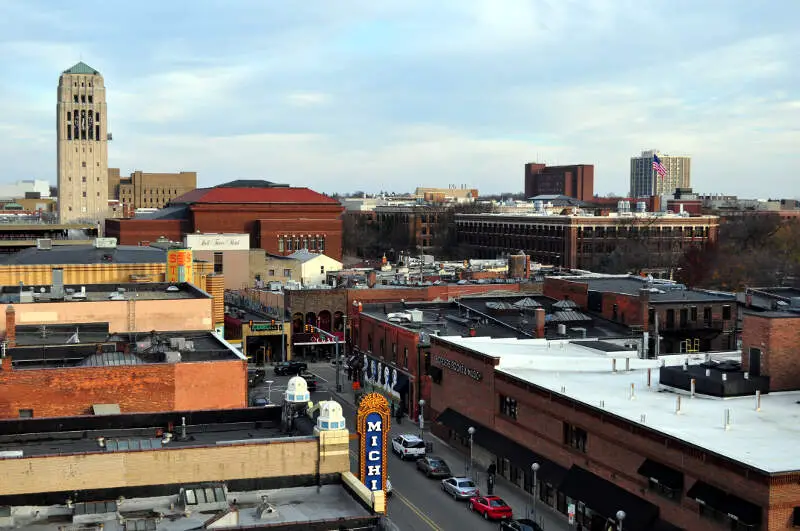
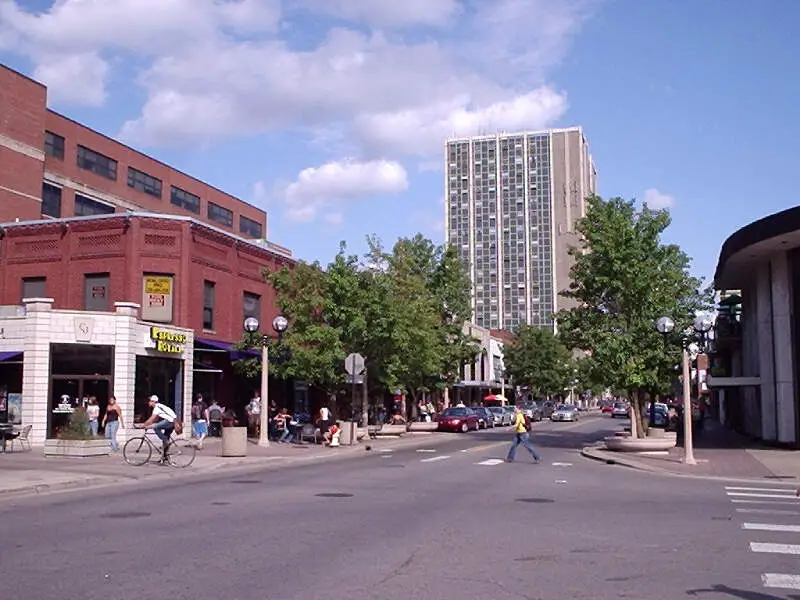
Ann Arbor, MI Photos
3 Reviews & Comments About Ann Arbor
/5

ChaseTrill -
I live in Ann Arbor... better than any city you been to.
HomeSnacks User - 2018-07-16 01:49:14.598889
The school their s***s. The colors are ugly and it smells like p**s.
The people there were obnoxious and stuck up. They aren't very friendly to outsiders.
HomeSnacks User - 2018-08-05 04:26:55.801609
When i lived in Ann Arbor, i never had to worry too much about crime or being out late because it was a college town.
I enjoyed being able to walk around and experience new things and try out the many different delicious foods around town.
Rankings for Ann Arbor in Michigan


Locations Around Ann Arbor
Map Of Ann Arbor, MI
Best Places Around Ann Arbor
Plymouth, MI
Population 9,300
Novi, MI
Population 65,870
Northville, MI
Population 6,088
Saline, MI
Population 8,973
South Lyon, MI
Population 11,788
Whitmore Lake, MI
Population 7,911
Milan, MI
Population 6,153
Westland, MI
Population 84,806
Ypsilanti, MI
Population 20,204
Wixom, MI
Population 17,007
Ann Arbor Demographics And Statistics
Population over time in Ann Arbor
The current population in Ann Arbor is 122,216. The population has increased 6.1% from 2010.
| Year | Population | % Change |
|---|---|---|
| 2022 | 122,216 | 1.3% |
| 2021 | 120,641 | 1.1% |
| 2020 | 119,303 | 1.0% |
| 2019 | 118,087 | 1.6% |
| 2018 | 116,194 | 0.2% |
| 2017 | 115,985 | 0.6% |
| 2016 | 115,331 | 0.5% |
| 2015 | 114,725 | -0.1% |
| 2014 | 114,783 | -0.4% |
| 2013 | 115,204 | - |
Race / Ethnicity in Ann Arbor
Ann Arbor is:
67.6% White with 82,571 White residents.
6.4% African American with 7,836 African American residents.
0.3% American Indian with 310 American Indian residents.
16.1% Asian with 19,665 Asian residents.
0.0% Hawaiian with 0 Hawaiian residents.
0.4% Other with 539 Other residents.
4.5% Two Or More with 5,463 Two Or More residents.
4.8% Hispanic with 5,832 Hispanic residents.
| Race | Ann Arbor | MI | USA |
|---|---|---|---|
| White | 67.6% | 73.5% | 58.9% |
| African American | 6.4% | 13.4% | 12.1% |
| American Indian | 0.3% | 0.3% | 0.6% |
| Asian | 16.1% | 3.2% | 5.7% |
| Hawaiian | 0.0% | 0.0% | 0.2% |
| Other | 0.4% | 0.3% | 0.4% |
| Two Or More | 4.5% | 3.7% | 3.5% |
| Hispanic | 4.8% | 5.5% | 18.7% |
Gender in Ann Arbor
Ann Arbor is 50.3% female with 61,492 female residents.
Ann Arbor is 49.7% male with 60,723 male residents.
| Gender | Ann Arbor | MI | USA |
|---|---|---|---|
| Female | 50.3% | 50.4% | 50.4% |
| Male | 49.7% | 49.6% | 49.6% |
Highest level of educational attainment in Ann Arbor for adults over 25
2.0% of adults in Ann Arbor completed < 9th grade.
1.0% of adults in Ann Arbor completed 9-12th grade.
7.0% of adults in Ann Arbor completed high school / ged.
9.0% of adults in Ann Arbor completed some college.
4.0% of adults in Ann Arbor completed associate's degree.
31.0% of adults in Ann Arbor completed bachelor's degree.
26.0% of adults in Ann Arbor completed master's degree.
8.0% of adults in Ann Arbor completed professional degree.
12.0% of adults in Ann Arbor completed doctorate degree.
| Education | Ann Arbor | MI | USA |
|---|---|---|---|
| < 9th Grade | 2.0% | 2.0% | 4.0% |
| 9-12th Grade | 1.0% | 6.0% | 6.0% |
| High School / GED | 7.0% | 28.0% | 26.0% |
| Some College | 9.0% | 23.0% | 20.0% |
| Associate's Degree | 4.0% | 10.0% | 9.0% |
| Bachelor's Degree | 31.0% | 19.0% | 21.0% |
| Master's Degree | 26.0% | 9.0% | 10.0% |
| Professional Degree | 8.0% | 2.0% | 2.0% |
| Doctorate Degree | 12.0% | 1.0% | 2.0% |
Household Income For Ann Arbor, Michigan
10.5% of households in Ann Arbor earn Less than $10,000.
3.7% of households in Ann Arbor earn $10,000 to $14,999.
5.7% of households in Ann Arbor earn $15,000 to $24,999.
5.6% of households in Ann Arbor earn $25,000 to $34,999.
8.6% of households in Ann Arbor earn $35,000 to $49,999.
14.0% of households in Ann Arbor earn $50,000 to $74,999.
11.4% of households in Ann Arbor earn $75,000 to $99,999.
15.1% of households in Ann Arbor earn $100,000 to $149,999.
8.9% of households in Ann Arbor earn $150,000 to $199,999.
16.4% of households in Ann Arbor earn $200,000 or more.
| Income | Ann Arbor | MI | USA |
|---|---|---|---|
| Less than $10,000 | 10.5% | 5.0% | 4.9% |
| $10,000 to $14,999 | 3.7% | 4.1% | 3.8% |
| $15,000 to $24,999 | 5.7% | 7.5% | 7.0% |
| $25,000 to $34,999 | 5.6% | 8.2% | 7.4% |
| $35,000 to $49,999 | 8.6% | 12.1% | 10.7% |
| $50,000 to $74,999 | 14.0% | 17.2% | 16.1% |
| $75,000 to $99,999 | 11.4% | 13.4% | 12.8% |
| $100,000 to $149,999 | 15.1% | 16.5% | 17.1% |
| $150,000 to $199,999 | 8.9% | 7.8% | 8.8% |
| $200,000 or more | 16.4% | 8.2% | 11.4% |


