Bay City, MI
Demographics And Statistics
Living In Bay City, Michigan Summary
Life in Bay City research summary. HomeSnacks has been using Saturday Night Science to research the quality of life in Bay City over the past nine years using Census, FBI, Zillow, and other primary data sources. Based on the most recently available data, we found the following about life in Bay City:
The population in Bay City is 32,664.
The median home value in Bay City is $103,660.
The median income in Bay City is $45,026.
The cost of living in Bay City is 85 which is 0.8x lower than the national average.
The median rent in Bay City is $726.
The unemployment rate in Bay City is 6.2%.
The poverty rate in Bay City is 24.8%.
The average high in Bay City is 57.0° and the average low is 38.0°.
Bay City SnackAbility
Overall SnackAbility
Bay City, MI Crime Report
Crime in Bay City summary. We use data from the FBI to determine the crime rates in Bay City. Key points include:
There were 563 total crimes in Bay City in the last reporting year.
The overall crime rate per 100,000 people in Bay City is 1,745.8 / 100k people.
The violent crime rate per 100,000 people in Bay City is 555.1 / 100k people.
The property crime rate per 100,000 people in Bay City is 1,190.7 / 100k people.
Overall, crime in Bay City is -24.89% below the national average.
Total Crimes
Below National Average
Crime In Bay City Comparison Table
| Statistic | Count Raw |
Bay City / 100k People |
Michigan / 100k People |
National / 100k People |
|---|---|---|---|---|
| Total Crimes Per 100K | 563 | 1,745.8 | 1,838.9 | 2,324.2 |
| Violent Crime | 179 | 555.1 | 478.0 | 369.8 |
| Murder | 0 | 0.0 | 7.6 | 6.3 |
| Robbery | 5 | 15.5 | 44.5 | 66.1 |
| Aggravated Assault | 145 | 449.6 | 365.1 | 268.2 |
| Property Crime | 384 | 1,190.7 | 1,360.9 | 1,954.4 |
| Burglary | 59 | 183.0 | 233.1 | 269.8 |
| Larceny | 288 | 893.1 | 943.3 | 1,401.9 |
| Car Theft | 37 | 114.7 | 184.5 | 282.7 |
Bay City, MI Cost Of Living
Cost of living in Bay City summary. We use data on the cost of living to determine how expensive it is to live in Bay City. Real estate prices drive most of the variance in cost of living around Michigan. Key points include:
The cost of living in Bay City is 85 with 100 being average.
The cost of living in Bay City is 0.8x lower than the national average.
The median home value in Bay City is $103,660.
The median income in Bay City is $45,026.
Bay City's Overall Cost Of Living
Lower Than The National Average
Cost Of Living In Bay City Comparison Table
| Living Expense | Bay City | Michigan | National Average | |
|---|---|---|---|---|
| Overall | 85 | 92 | 100 | |
| Services | 105 | 96 | 100 | |
| Groceries | 102 | 96 | 100 | |
| Health | 101 | 94 | 100 | |
| Housing | 45 | 80 | 100 | |
| Transportation | 100 | 97 | 100 | |
| Utilities | 99 | 100 | 100 | |
Bay City, MI Weather
The average high in Bay City is 57.0° and the average low is 38.0°.
There are 70.1 days of precipitation each year.
Expect an average of 31.2 inches of precipitation each year with 41.2 inches of snow.
| Stat | Bay City |
|---|---|
| Average Annual High | 57.0 |
| Average Annual Low | 38.0 |
| Annual Precipitation Days | 70.1 |
| Average Annual Precipitation | 31.2 |
| Average Annual Snowfall | 41.2 |
Average High
Days of Rain
Bay City, MI Photos


1 Reviews & Comments About Bay City
/5

HomeSnacks User - 2018-08-04 23:46:34.582766
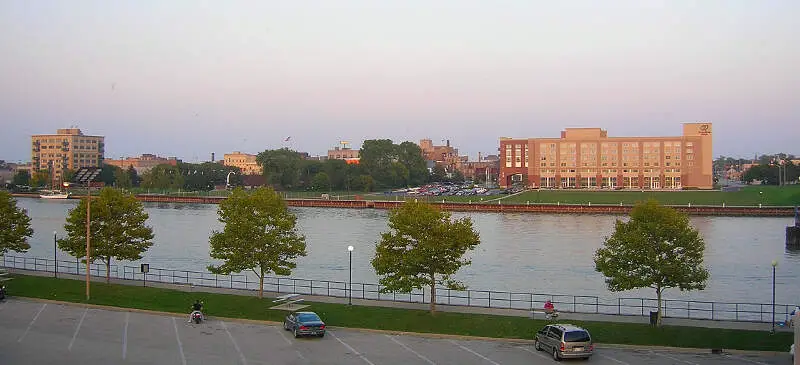
I loved visiting Bay City Mi. There is so much to do there. There are boardwalks and water and shops and parks. A wonderful place to vacation
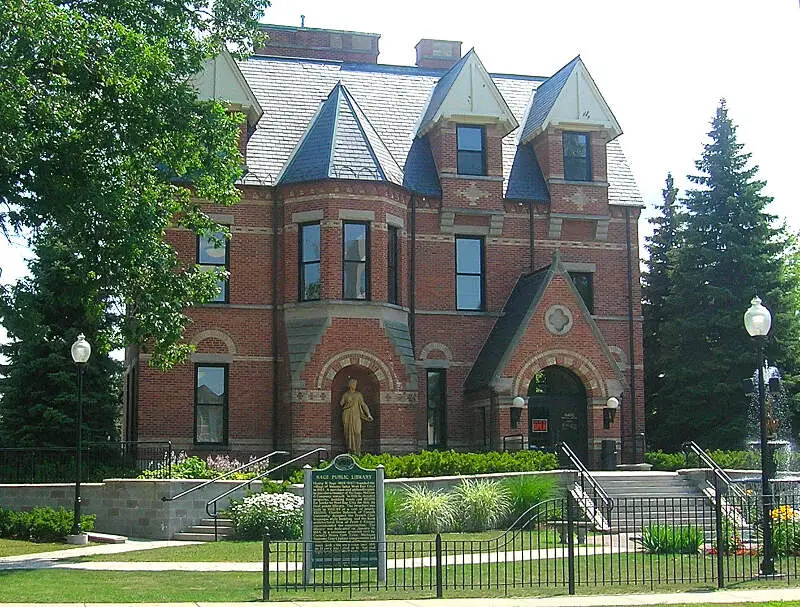
There was nothing bad and what stood out were the Victorian houses - you can even tour some of them!
Rankings for Bay City in Michigan


Locations Around Bay City
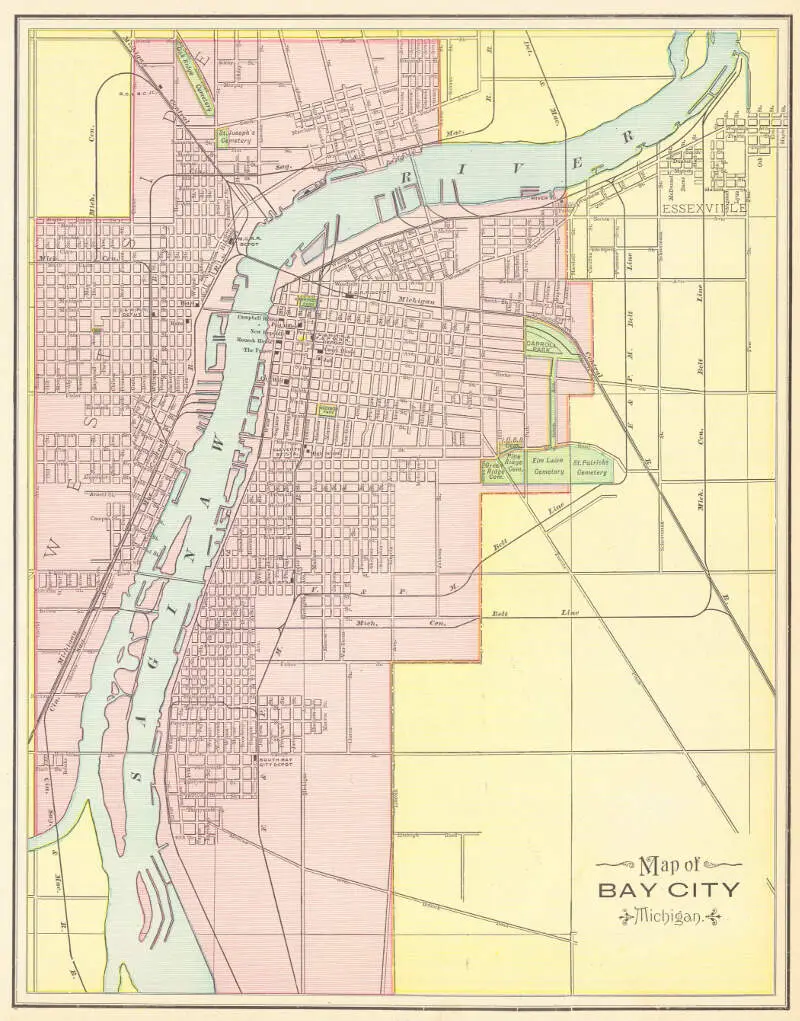
Map Of Bay City, MI
Best Places Around Bay City
Bay City Demographics And Statistics
Population over time in Bay City
The current population in Bay City is 32,664. The population has decreased -7.3% from 2010.
| Year | Population | % Change |
|---|---|---|
| 2022 | 32,664 | -2.4% |
| 2021 | 33,463 | -0.8% |
| 2020 | 33,736 | -1.1% |
| 2019 | 34,110 | -0.8% |
| 2018 | 34,402 | -0.5% |
| 2017 | 34,578 | -0.4% |
| 2016 | 34,717 | -0.5% |
| 2015 | 34,899 | -0.5% |
| 2014 | 35,080 | -0.4% |
| 2013 | 35,235 | - |
Race / Ethnicity in Bay City
Bay City is:
81.8% White with 26,705 White residents.
2.7% African American with 895 African American residents.
0.2% American Indian with 54 American Indian residents.
0.3% Asian with 109 Asian residents.
0.2% Hawaiian with 55 Hawaiian residents.
0.2% Other with 79 Other residents.
4.0% Two Or More with 1,295 Two Or More residents.
10.6% Hispanic with 3,472 Hispanic residents.
| Race | Bay City | MI | USA |
|---|---|---|---|
| White | 81.8% | 73.5% | 58.9% |
| African American | 2.7% | 13.4% | 12.1% |
| American Indian | 0.2% | 0.3% | 0.6% |
| Asian | 0.3% | 3.2% | 5.7% |
| Hawaiian | 0.2% | 0.0% | 0.2% |
| Other | 0.2% | 0.3% | 0.4% |
| Two Or More | 4.0% | 3.7% | 3.5% |
| Hispanic | 10.6% | 5.5% | 18.7% |
Gender in Bay City
Bay City is 52.6% female with 17,190 female residents.
Bay City is 47.4% male with 15,474 male residents.
| Gender | Bay City | MI | USA |
|---|---|---|---|
| Female | 52.6% | 50.4% | 50.4% |
| Male | 47.4% | 49.6% | 49.6% |
Highest level of educational attainment in Bay City for adults over 25
3.0% of adults in Bay City completed < 9th grade.
9.0% of adults in Bay City completed 9-12th grade.
35.0% of adults in Bay City completed high school / ged.
26.0% of adults in Bay City completed some college.
9.0% of adults in Bay City completed associate's degree.
12.0% of adults in Bay City completed bachelor's degree.
4.0% of adults in Bay City completed master's degree.
1.0% of adults in Bay City completed professional degree.
1.0% of adults in Bay City completed doctorate degree.
| Education | Bay City | MI | USA |
|---|---|---|---|
| < 9th Grade | 3.0% | 2.0% | 4.0% |
| 9-12th Grade | 9.0% | 6.0% | 6.0% |
| High School / GED | 35.0% | 28.0% | 26.0% |
| Some College | 26.0% | 23.0% | 20.0% |
| Associate's Degree | 9.0% | 10.0% | 9.0% |
| Bachelor's Degree | 12.0% | 19.0% | 21.0% |
| Master's Degree | 4.0% | 9.0% | 10.0% |
| Professional Degree | 1.0% | 2.0% | 2.0% |
| Doctorate Degree | 1.0% | 1.0% | 2.0% |
Household Income For Bay City, Michigan
7.1% of households in Bay City earn Less than $10,000.
9.3% of households in Bay City earn $10,000 to $14,999.
10.9% of households in Bay City earn $15,000 to $24,999.
12.0% of households in Bay City earn $25,000 to $34,999.
16.0% of households in Bay City earn $35,000 to $49,999.
17.1% of households in Bay City earn $50,000 to $74,999.
12.4% of households in Bay City earn $75,000 to $99,999.
9.4% of households in Bay City earn $100,000 to $149,999.
2.8% of households in Bay City earn $150,000 to $199,999.
3.2% of households in Bay City earn $200,000 or more.
| Income | Bay City | MI | USA |
|---|---|---|---|
| Less than $10,000 | 7.1% | 5.0% | 4.9% |
| $10,000 to $14,999 | 9.3% | 4.1% | 3.8% |
| $15,000 to $24,999 | 10.9% | 7.5% | 7.0% |
| $25,000 to $34,999 | 12.0% | 8.2% | 7.4% |
| $35,000 to $49,999 | 16.0% | 12.1% | 10.7% |
| $50,000 to $74,999 | 17.1% | 17.2% | 16.1% |
| $75,000 to $99,999 | 12.4% | 13.4% | 12.8% |
| $100,000 to $149,999 | 9.4% | 16.5% | 17.1% |
| $150,000 to $199,999 | 2.8% | 7.8% | 8.8% |
| $200,000 or more | 3.2% | 8.2% | 11.4% |


