Menominee, MI
Demographics And Statistics
Living In Menominee, Michigan Summary
Life in Menominee research summary. HomeSnacks has been using Saturday Night Science to research the quality of life in Menominee over the past nine years using Census, FBI, Zillow, and other primary data sources. Based on the most recently available data, we found the following about life in Menominee:
The population in Menominee is 8,429.
The median home value in Menominee is $151,178.
The median income in Menominee is $46,821.
The cost of living in Menominee is 79 which is 0.8x lower than the national average.
The median rent in Menominee is $702.
The unemployment rate in Menominee is 4.1%.
The poverty rate in Menominee is 13.7%.
The average high in Menominee is 53.4° and the average low is 34.7°.
Menominee SnackAbility
Overall SnackAbility
Menominee, MI Crime Report
Crime in Menominee summary. We use data from the FBI to determine the crime rates in Menominee. Key points include:
There were 148 total crimes in Menominee in the last reporting year.
The overall crime rate per 100,000 people in Menominee is 1,780.1 / 100k people.
The violent crime rate per 100,000 people in Menominee is 433.0 / 100k people.
The property crime rate per 100,000 people in Menominee is 1,347.1 / 100k people.
Overall, crime in Menominee is -23.41% below the national average.
Total Crimes
Below National Average
Crime In Menominee Comparison Table
| Statistic | Count Raw |
Menominee / 100k People |
Michigan / 100k People |
National / 100k People |
|---|---|---|---|---|
| Total Crimes Per 100K | 148 | 1,780.1 | 1,838.9 | 2,324.2 |
| Violent Crime | 36 | 433.0 | 478.0 | 369.8 |
| Murder | 0 | 0.0 | 7.6 | 6.3 |
| Robbery | 0 | 0.0 | 44.5 | 66.1 |
| Aggravated Assault | 19 | 228.5 | 365.1 | 268.2 |
| Property Crime | 112 | 1,347.1 | 1,360.9 | 1,954.4 |
| Burglary | 20 | 240.6 | 233.1 | 269.8 |
| Larceny | 86 | 1,034.4 | 943.3 | 1,401.9 |
| Car Theft | 6 | 72.2 | 184.5 | 282.7 |
Menominee, MI Cost Of Living
Cost of living in Menominee summary. We use data on the cost of living to determine how expensive it is to live in Menominee. Real estate prices drive most of the variance in cost of living around Michigan. Key points include:
The cost of living in Menominee is 79 with 100 being average.
The cost of living in Menominee is 0.8x lower than the national average.
The median home value in Menominee is $151,178.
The median income in Menominee is $46,821.
Menominee's Overall Cost Of Living
Lower Than The National Average
Cost Of Living In Menominee Comparison Table
| Living Expense | Menominee | Michigan | National Average | |
|---|---|---|---|---|
| Overall | 79 | 92 | 100 | |
| Services | 94 | 96 | 100 | |
| Groceries | 91 | 96 | 100 | |
| Health | 100 | 94 | 100 | |
| Housing | 45 | 80 | 100 | |
| Transportation | 93 | 97 | 100 | |
| Utilities | 96 | 100 | 100 | |
Menominee, MI Weather
The average high in Menominee is 53.4° and the average low is 34.7°.
There are 69.8 days of precipitation each year.
Expect an average of 31.8 inches of precipitation each year with 45.3 inches of snow.
| Stat | Menominee |
|---|---|
| Average Annual High | 53.4 |
| Average Annual Low | 34.7 |
| Annual Precipitation Days | 69.8 |
| Average Annual Precipitation | 31.8 |
| Average Annual Snowfall | 45.3 |
Average High
Days of Rain
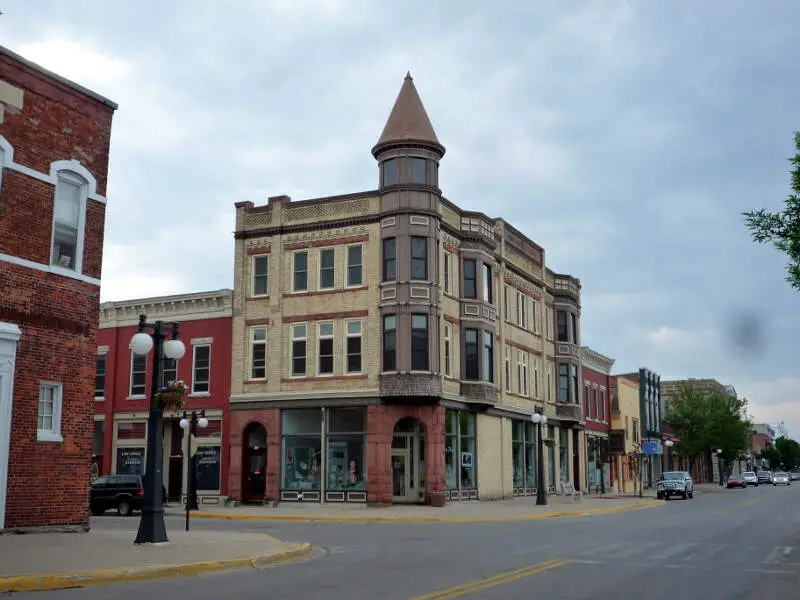
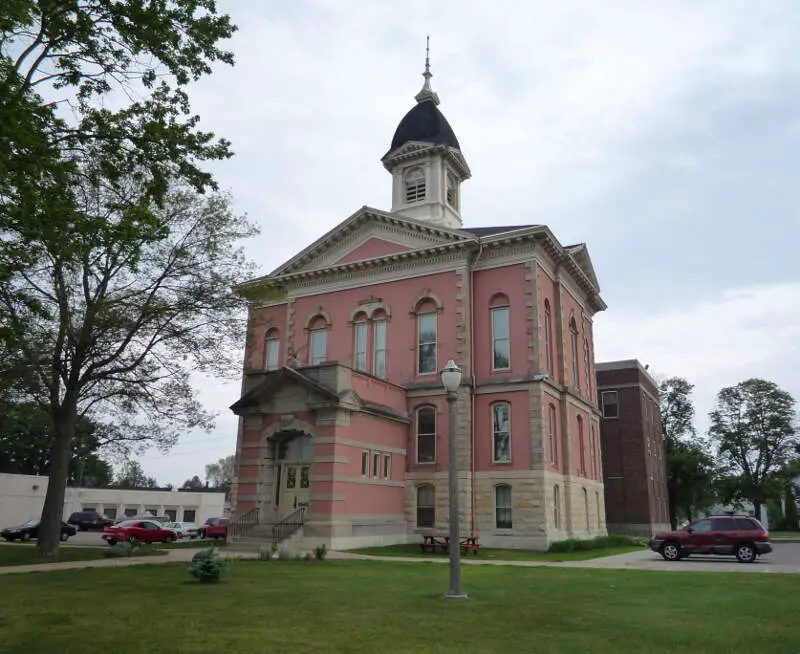
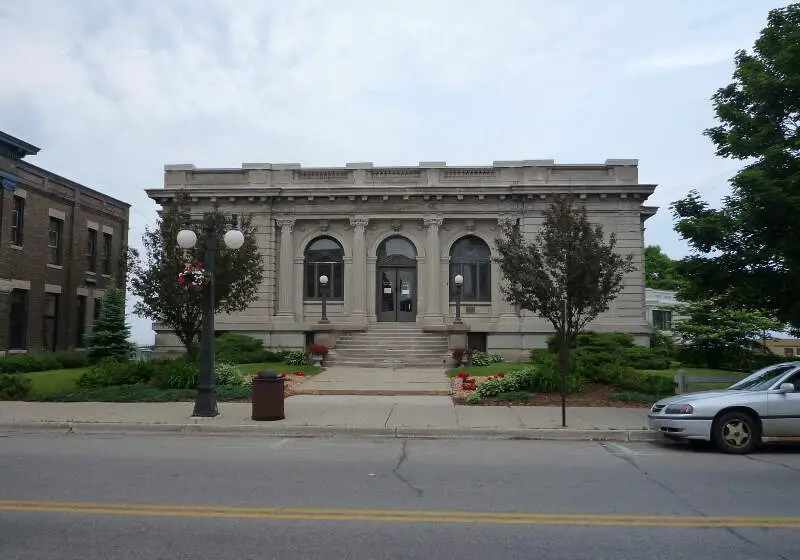
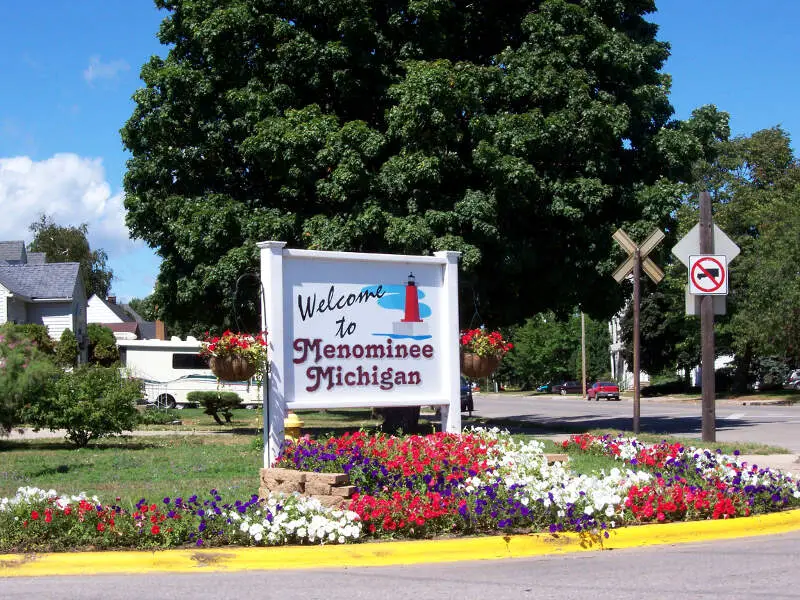
Menominee, MI Photos


Rankings for Menominee in Michigan


Locations Around Menominee
Map Of Menominee, MI
Best Places Around Menominee
Allouez, WI
Population 14,089
Suamico, WI
Population 12,878
Suamico, WI
Population 12,878
Bellevue, WI
Population 16,086
Bellevue, WI
Population 16,086
Howard, WI
Population 20,022
Ashwaubenon, WI
Population 16,939
Sturgeon Bay, WI
Population 9,620
Green Bay, WI
Population 106,846
Marinette, WI
Population 11,065
Menominee Demographics And Statistics
Population over time in Menominee
The current population in Menominee is 8,429. The population has decreased -3.0% from 2010.
| Year | Population | % Change |
|---|---|---|
| 2022 | 8,429 | 2.6% |
| 2021 | 8,214 | -1.0% |
| 2020 | 8,298 | -1.0% |
| 2019 | 8,378 | -0.9% |
| 2018 | 8,456 | -0.7% |
| 2017 | 8,516 | -0.4% |
| 2016 | 8,546 | -0.7% |
| 2015 | 8,603 | -0.5% |
| 2014 | 8,647 | -0.5% |
| 2013 | 8,689 | - |
Race / Ethnicity in Menominee
Menominee is:
93.5% White with 7,883 White residents.
0.3% African American with 23 African American residents.
0.2% American Indian with 19 American Indian residents.
0.0% Asian with 0 Asian residents.
0.0% Hawaiian with 0 Hawaiian residents.
0.0% Other with 0 Other residents.
3.7% Two Or More with 315 Two Or More residents.
2.2% Hispanic with 189 Hispanic residents.
| Race | Menominee | MI | USA |
|---|---|---|---|
| White | 93.5% | 73.5% | 58.9% |
| African American | 0.3% | 13.4% | 12.1% |
| American Indian | 0.2% | 0.3% | 0.6% |
| Asian | 0.0% | 3.2% | 5.7% |
| Hawaiian | 0.0% | 0.0% | 0.2% |
| Other | 0.0% | 0.3% | 0.4% |
| Two Or More | 3.7% | 3.7% | 3.5% |
| Hispanic | 2.2% | 5.5% | 18.7% |
Gender in Menominee
Menominee is 48.5% female with 4,092 female residents.
Menominee is 51.5% male with 4,337 male residents.
| Gender | Menominee | MI | USA |
|---|---|---|---|
| Female | 48.5% | 50.4% | 50.4% |
| Male | 51.5% | 49.6% | 49.6% |
Highest level of educational attainment in Menominee for adults over 25
2.0% of adults in Menominee completed < 9th grade.
6.0% of adults in Menominee completed 9-12th grade.
45.0% of adults in Menominee completed high school / ged.
22.0% of adults in Menominee completed some college.
10.0% of adults in Menominee completed associate's degree.
9.0% of adults in Menominee completed bachelor's degree.
5.0% of adults in Menominee completed master's degree.
0.0% of adults in Menominee completed professional degree.
1.0% of adults in Menominee completed doctorate degree.
| Education | Menominee | MI | USA |
|---|---|---|---|
| < 9th Grade | 2.0% | 2.0% | 4.0% |
| 9-12th Grade | 6.0% | 6.0% | 6.0% |
| High School / GED | 45.0% | 28.0% | 26.0% |
| Some College | 22.0% | 23.0% | 20.0% |
| Associate's Degree | 10.0% | 10.0% | 9.0% |
| Bachelor's Degree | 9.0% | 19.0% | 21.0% |
| Master's Degree | 5.0% | 9.0% | 10.0% |
| Professional Degree | 0.0% | 2.0% | 2.0% |
| Doctorate Degree | 1.0% | 1.0% | 2.0% |
Household Income For Menominee, Michigan
8.6% of households in Menominee earn Less than $10,000.
6.6% of households in Menominee earn $10,000 to $14,999.
8.0% of households in Menominee earn $15,000 to $24,999.
12.4% of households in Menominee earn $25,000 to $34,999.
17.6% of households in Menominee earn $35,000 to $49,999.
18.7% of households in Menominee earn $50,000 to $74,999.
12.8% of households in Menominee earn $75,000 to $99,999.
12.4% of households in Menominee earn $100,000 to $149,999.
0.8% of households in Menominee earn $150,000 to $199,999.
1.9% of households in Menominee earn $200,000 or more.
| Income | Menominee | MI | USA |
|---|---|---|---|
| Less than $10,000 | 8.6% | 5.0% | 4.9% |
| $10,000 to $14,999 | 6.6% | 4.1% | 3.8% |
| $15,000 to $24,999 | 8.0% | 7.5% | 7.0% |
| $25,000 to $34,999 | 12.4% | 8.2% | 7.4% |
| $35,000 to $49,999 | 17.6% | 12.1% | 10.7% |
| $50,000 to $74,999 | 18.7% | 17.2% | 16.1% |
| $75,000 to $99,999 | 12.8% | 13.4% | 12.8% |
| $100,000 to $149,999 | 12.4% | 16.5% | 17.1% |
| $150,000 to $199,999 | 0.8% | 7.8% | 8.8% |
| $200,000 or more | 1.9% | 8.2% | 11.4% |


