Buffalo, MN
Demographics And Statistics
Living In Buffalo, Minnesota Summary
Life in Buffalo research summary. HomeSnacks has been using Saturday Night Science to research the quality of life in Buffalo over the past nine years using Census, FBI, Zillow, and other primary data sources. Based on the most recently available data, we found the following about life in Buffalo:
The population in Buffalo is 16,288.
The median home value in Buffalo is $354,423.
The median income in Buffalo is $81,868.
The cost of living in Buffalo is 106 which is 1.1x higher than the national average.
The median rent in Buffalo is $1,037.
The unemployment rate in Buffalo is 3.9%.
The poverty rate in Buffalo is 6.6%.
The average high in Buffalo is 54.2° and the average low is 34.5°.
Buffalo SnackAbility
Overall SnackAbility
Buffalo, MN Crime Report
Crime in Buffalo summary. We use data from the FBI to determine the crime rates in Buffalo. Key points include:
There were 125 total crimes in Buffalo in the last reporting year.
The overall crime rate per 100,000 people in Buffalo is 756.2 / 100k people.
The violent crime rate per 100,000 people in Buffalo is 12.1 / 100k people.
The property crime rate per 100,000 people in Buffalo is 744.1 / 100k people.
Overall, crime in Buffalo is -67.47% below the national average.
Total Crimes
Below National Average
Crime In Buffalo Comparison Table
| Statistic | Count Raw |
Buffalo / 100k People |
Minnesota / 100k People |
National / 100k People |
|---|---|---|---|---|
| Total Crimes Per 100K | 125 | 756.2 | 2,402.4 | 2,324.2 |
| Violent Crime | 2 | 12.1 | 277.5 | 369.8 |
| Murder | 0 | 0.0 | 3.4 | 6.3 |
| Robbery | 0 | 0.0 | 68.5 | 66.1 |
| Aggravated Assault | 2 | 12.1 | 166.5 | 268.2 |
| Property Crime | 123 | 744.1 | 2,124.9 | 1,954.4 |
| Burglary | 12 | 72.6 | 307.0 | 269.8 |
| Larceny | 99 | 598.9 | 1,567.8 | 1,401.9 |
| Car Theft | 12 | 72.6 | 250.0 | 282.7 |
Buffalo, MN Cost Of Living
Cost of living in Buffalo summary. We use data on the cost of living to determine how expensive it is to live in Buffalo. Real estate prices drive most of the variance in cost of living around Minnesota. Key points include:
The cost of living in Buffalo is 106 with 100 being average.
The cost of living in Buffalo is 1.1x higher than the national average.
The median home value in Buffalo is $354,423.
The median income in Buffalo is $81,868.
Buffalo's Overall Cost Of Living
Higher Than The National Average
Cost Of Living In Buffalo Comparison Table
| Living Expense | Buffalo | Minnesota | National Average | |
|---|---|---|---|---|
| Overall | 106 | 95 | 100 | |
| Services | 107 | 101 | 100 | |
| Groceries | 108 | 98 | 100 | |
| Health | 128 | 111 | 100 | |
| Housing | 98 | 83 | 100 | |
| Transportation | 95 | 98 | 100 | |
| Utilities | 96 | 95 | 100 | |
Buffalo, MN Weather
The average high in Buffalo is 54.2° and the average low is 34.5°.
There are 56.2 days of precipitation each year.
Expect an average of 30.2 inches of precipitation each year with 42.2 inches of snow.
| Stat | Buffalo |
|---|---|
| Average Annual High | 54.2 |
| Average Annual Low | 34.5 |
| Annual Precipitation Days | 56.2 |
| Average Annual Precipitation | 30.2 |
| Average Annual Snowfall | 42.2 |
Average High
Days of Rain
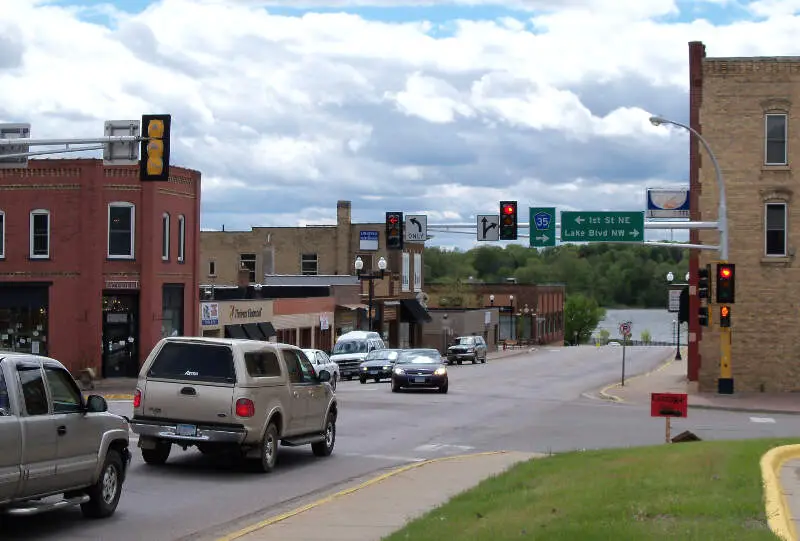
Buffalo, MN Photos
Buffalo Articles


Rankings for Buffalo in Minnesota

Locations Around Buffalo
Map Of Buffalo, MN
Best Places Around Buffalo
Rogers, MN
Population 13,283
Minnetrista, MN
Population 8,347
Corcoran, MN
Population 6,549
Mound, MN
Population 9,272
St. Michael, MN
Population 18,648
Albertville, MN
Population 7,883
Otsego, MN
Population 20,455
Delano, MN
Population 6,539
Big Lake, MN
Population 383
Big Lake, MN
Population 383
Buffalo Demographics And Statistics
Population over time in Buffalo
The current population in Buffalo is 16,288. The population has increased 10.3% from 2010.
| Year | Population | % Change |
|---|---|---|
| 2022 | 16,288 | 1.2% |
| 2021 | 16,092 | 0.6% |
| 2020 | 15,996 | 0.4% |
| 2019 | 15,927 | 0.6% |
| 2018 | 15,825 | 0.7% |
| 2017 | 15,710 | 0.8% |
| 2016 | 15,592 | 1.4% |
| 2015 | 15,379 | 1.7% |
| 2014 | 15,127 | 2.4% |
| 2013 | 14,771 | - |
Race / Ethnicity in Buffalo
Buffalo is:
93.3% White with 15,204 White residents.
0.2% African American with 29 African American residents.
0.2% American Indian with 25 American Indian residents.
1.7% Asian with 281 Asian residents.
0.0% Hawaiian with 0 Hawaiian residents.
0.2% Other with 32 Other residents.
2.7% Two Or More with 437 Two Or More residents.
1.7% Hispanic with 280 Hispanic residents.
| Race | Buffalo | MN | USA |
|---|---|---|---|
| White | 93.3% | 77.7% | 58.9% |
| African American | 0.2% | 6.6% | 12.1% |
| American Indian | 0.2% | 0.8% | 0.6% |
| Asian | 1.7% | 5.0% | 5.7% |
| Hawaiian | 0.0% | 0.0% | 0.2% |
| Other | 0.2% | 0.4% | 0.4% |
| Two Or More | 2.7% | 3.8% | 3.5% |
| Hispanic | 1.7% | 5.7% | 18.7% |
Gender in Buffalo
Buffalo is 51.0% female with 8,303 female residents.
Buffalo is 49.0% male with 7,985 male residents.
| Gender | Buffalo | MN | USA |
|---|---|---|---|
| Female | 51.0% | 49.8% | 50.4% |
| Male | 49.0% | 50.2% | 49.6% |
Highest level of educational attainment in Buffalo for adults over 25
3.0% of adults in Buffalo completed < 9th grade.
4.0% of adults in Buffalo completed 9-12th grade.
27.0% of adults in Buffalo completed high school / ged.
25.0% of adults in Buffalo completed some college.
11.0% of adults in Buffalo completed associate's degree.
19.0% of adults in Buffalo completed bachelor's degree.
9.0% of adults in Buffalo completed master's degree.
1.0% of adults in Buffalo completed professional degree.
1.0% of adults in Buffalo completed doctorate degree.
| Education | Buffalo | MN | USA |
|---|---|---|---|
| < 9th Grade | 3.0% | 2.0% | 4.0% |
| 9-12th Grade | 4.0% | 4.0% | 6.0% |
| High School / GED | 27.0% | 24.0% | 26.0% |
| Some College | 25.0% | 20.0% | 20.0% |
| Associate's Degree | 11.0% | 12.0% | 9.0% |
| Bachelor's Degree | 19.0% | 25.0% | 21.0% |
| Master's Degree | 9.0% | 9.0% | 10.0% |
| Professional Degree | 1.0% | 2.0% | 2.0% |
| Doctorate Degree | 1.0% | 2.0% | 2.0% |
Household Income For Buffalo, Minnesota
3.5% of households in Buffalo earn Less than $10,000.
1.0% of households in Buffalo earn $10,000 to $14,999.
7.5% of households in Buffalo earn $15,000 to $24,999.
7.6% of households in Buffalo earn $25,000 to $34,999.
9.8% of households in Buffalo earn $35,000 to $49,999.
15.4% of households in Buffalo earn $50,000 to $74,999.
16.0% of households in Buffalo earn $75,000 to $99,999.
18.3% of households in Buffalo earn $100,000 to $149,999.
14.4% of households in Buffalo earn $150,000 to $199,999.
6.5% of households in Buffalo earn $200,000 or more.
| Income | Buffalo | MN | USA |
|---|---|---|---|
| Less than $10,000 | 3.5% | 3.6% | 4.9% |
| $10,000 to $14,999 | 1.0% | 3.0% | 3.8% |
| $15,000 to $24,999 | 7.5% | 5.8% | 7.0% |
| $25,000 to $34,999 | 7.6% | 6.3% | 7.4% |
| $35,000 to $49,999 | 9.8% | 9.9% | 10.7% |
| $50,000 to $74,999 | 15.4% | 16.1% | 16.1% |
| $75,000 to $99,999 | 16.0% | 13.6% | 12.8% |
| $100,000 to $149,999 | 18.3% | 19.6% | 17.1% |
| $150,000 to $199,999 | 14.4% | 10.4% | 8.8% |
| $200,000 or more | 6.5% | 11.9% | 11.4% |


