Mound, MN
Demographics And Statistics
Living In Mound, Minnesota Summary
Life in Mound research summary. HomeSnacks has been using Saturday Night Science to research the quality of life in Mound over the past nine years using Census, FBI, Zillow, and other primary data sources. Based on the most recently available data, we found the following about life in Mound:
The population in Mound is 9,272.
The median home value in Mound is $360,628.
The median income in Mound is $89,855.
The cost of living in Mound is 107 which is 1.1x higher than the national average.
The median rent in Mound is $1,050.
The unemployment rate in Mound is 3.6%.
The poverty rate in Mound is 7.6%.
The average high in Mound is 54.6° and the average low is 35.5°.
Table Of Contents
Mound SnackAbility
Overall SnackAbility
Mound, MN Cost Of Living
Cost of living in Mound summary. We use data on the cost of living to determine how expensive it is to live in Mound. Real estate prices drive most of the variance in cost of living around Minnesota. Key points include:
The cost of living in Mound is 107 with 100 being average.
The cost of living in Mound is 1.1x higher than the national average.
The median home value in Mound is $360,628.
The median income in Mound is $89,855.
Mound's Overall Cost Of Living
Higher Than The National Average
Cost Of Living In Mound Comparison Table
| Living Expense | Mound | Minnesota | National Average | |
|---|---|---|---|---|
| Overall | 107 | 95 | 100 | |
| Services | 105 | 101 | 100 | |
| Groceries | 97 | 98 | 100 | |
| Health | 100 | 111 | 100 | |
| Housing | 111 | 83 | 100 | |
| Transportation | 106 | 98 | 100 | |
| Utilities | 101 | 95 | 100 | |
Mound, MN Weather
The average high in Mound is 54.6° and the average low is 35.5°.
There are 57.0 days of precipitation each year.
Expect an average of 31.1 inches of precipitation each year with 49.0 inches of snow.
| Stat | Mound |
|---|---|
| Average Annual High | 54.6 |
| Average Annual Low | 35.5 |
| Annual Precipitation Days | 57.0 |
| Average Annual Precipitation | 31.1 |
| Average Annual Snowfall | 49.0 |
Average High
Days of Rain
Mound, MN Photos


Rankings for Mound in Minnesota


Locations Around Mound
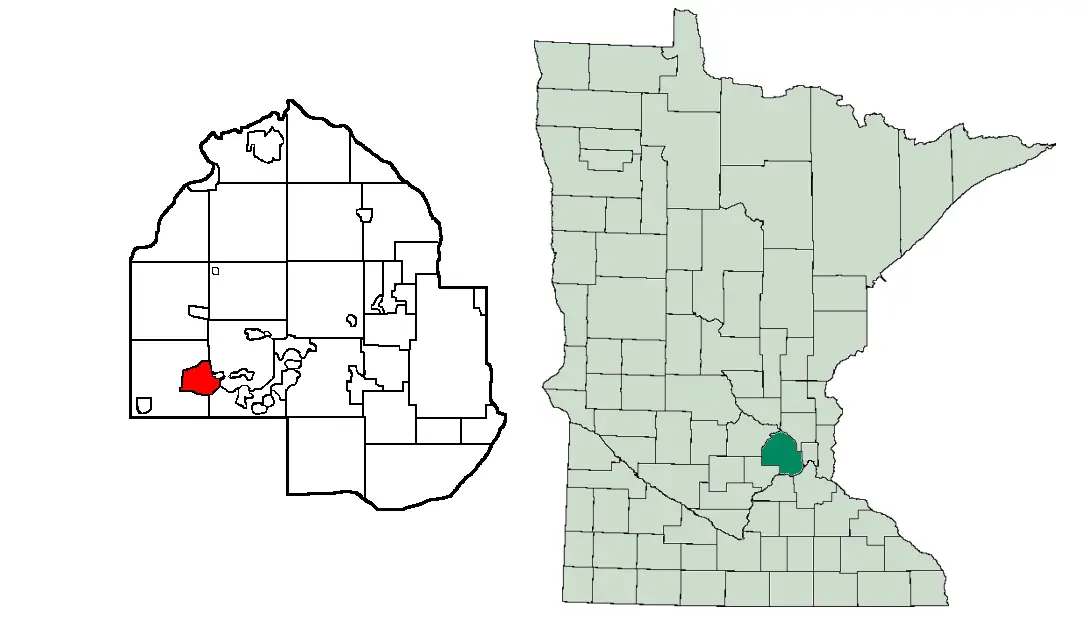
Map Of Mound, MN
Best Places Around Mound
Maple Grove, MN
Population 70,110
Edina, MN
Population 53,037
Plymouth, MN
Population 79,918
Eden Prairie, MN
Population 63,623
Shorewood, MN
Population 7,722
Minnetonka, MN
Population 53,529
Rogers, MN
Population 13,283
Minnetrista, MN
Population 8,347
Golden Valley, MN
Population 22,142
Victoria, MN
Population 10,681
Mound Demographics And Statistics
Population over time in Mound
The current population in Mound is 9,272. The population has increased 2.6% from 2010.
| Year | Population | % Change |
|---|---|---|
| 2022 | 9,272 | -1.5% |
| 2021 | 9,412 | 0.3% |
| 2020 | 9,380 | 0.8% |
| 2019 | 9,306 | 0.6% |
| 2018 | 9,249 | 0.5% |
| 2017 | 9,205 | 0.5% |
| 2016 | 9,159 | 0.6% |
| 2015 | 9,108 | 0.4% |
| 2014 | 9,069 | 0.4% |
| 2013 | 9,037 | - |
Race / Ethnicity in Mound
Mound is:
87.5% White with 8,111 White residents.
1.3% African American with 125 African American residents.
0.0% American Indian with 0 American Indian residents.
1.7% Asian with 154 Asian residents.
0.0% Hawaiian with 0 Hawaiian residents.
1.9% Other with 178 Other residents.
4.4% Two Or More with 410 Two Or More residents.
3.2% Hispanic with 294 Hispanic residents.
| Race | Mound | MN | USA |
|---|---|---|---|
| White | 87.5% | 77.7% | 58.9% |
| African American | 1.3% | 6.6% | 12.1% |
| American Indian | 0.0% | 0.8% | 0.6% |
| Asian | 1.7% | 5.0% | 5.7% |
| Hawaiian | 0.0% | 0.0% | 0.2% |
| Other | 1.9% | 0.4% | 0.4% |
| Two Or More | 4.4% | 3.8% | 3.5% |
| Hispanic | 3.2% | 5.7% | 18.7% |
Gender in Mound
Mound is 45.8% female with 4,250 female residents.
Mound is 54.2% male with 5,022 male residents.
| Gender | Mound | MN | USA |
|---|---|---|---|
| Female | 45.8% | 49.8% | 50.4% |
| Male | 54.2% | 50.2% | 49.6% |
Highest level of educational attainment in Mound for adults over 25
0.0% of adults in Mound completed < 9th grade.
0.0% of adults in Mound completed 9-12th grade.
22.0% of adults in Mound completed high school / ged.
24.0% of adults in Mound completed some college.
9.0% of adults in Mound completed associate's degree.
30.0% of adults in Mound completed bachelor's degree.
11.0% of adults in Mound completed master's degree.
3.0% of adults in Mound completed professional degree.
1.0% of adults in Mound completed doctorate degree.
| Education | Mound | MN | USA |
|---|---|---|---|
| < 9th Grade | 0.0% | 2.0% | 4.0% |
| 9-12th Grade | 0.0% | 4.0% | 6.0% |
| High School / GED | 22.0% | 24.0% | 26.0% |
| Some College | 24.0% | 20.0% | 20.0% |
| Associate's Degree | 9.0% | 12.0% | 9.0% |
| Bachelor's Degree | 30.0% | 25.0% | 21.0% |
| Master's Degree | 11.0% | 9.0% | 10.0% |
| Professional Degree | 3.0% | 2.0% | 2.0% |
| Doctorate Degree | 1.0% | 2.0% | 2.0% |
Household Income For Mound, Minnesota
2.1% of households in Mound earn Less than $10,000.
5.5% of households in Mound earn $10,000 to $14,999.
9.7% of households in Mound earn $15,000 to $24,999.
4.0% of households in Mound earn $25,000 to $34,999.
4.2% of households in Mound earn $35,000 to $49,999.
14.7% of households in Mound earn $50,000 to $74,999.
13.0% of households in Mound earn $75,000 to $99,999.
17.4% of households in Mound earn $100,000 to $149,999.
12.6% of households in Mound earn $150,000 to $199,999.
16.7% of households in Mound earn $200,000 or more.
| Income | Mound | MN | USA |
|---|---|---|---|
| Less than $10,000 | 2.1% | 3.6% | 4.9% |
| $10,000 to $14,999 | 5.5% | 3.0% | 3.8% |
| $15,000 to $24,999 | 9.7% | 5.8% | 7.0% |
| $25,000 to $34,999 | 4.0% | 6.3% | 7.4% |
| $35,000 to $49,999 | 4.2% | 9.9% | 10.7% |
| $50,000 to $74,999 | 14.7% | 16.1% | 16.1% |
| $75,000 to $99,999 | 13.0% | 13.6% | 12.8% |
| $100,000 to $149,999 | 17.4% | 19.6% | 17.1% |
| $150,000 to $199,999 | 12.6% | 10.4% | 8.8% |
| $200,000 or more | 16.7% | 11.9% | 11.4% |


