St. Paul, MN
Demographics And Statistics
Living In St. Paul, Minnesota Summary
Life in St. Paul research summary. HomeSnacks has been using Saturday Night Science to research the quality of life in St. Paul over the past nine years using Census, FBI, Zillow, and other primary data sources. Based on the most recently available data, we found the following about life in St. Paul:
The population in St. Paul is 308,806.
The median home value in St. Paul is $278,672.
The median income in St. Paul is $69,919.
The cost of living in St. Paul is 99 which is 1.0x lower than the national average.
The median rent in St. Paul is $1,174.
The unemployment rate in St. Paul is 5.0%.
The poverty rate in St. Paul is 16.7%.
The average high in St. Paul is 55.4° and the average low is 36.9°.
St. Paul SnackAbility
Overall SnackAbility
St. Paul, MN Crime Report
Crime in St. Paul summary. We use data from the FBI to determine the crime rates in St. Paul. Key points include:
There were 15,027 total crimes in St. Paul in the last reporting year.
The overall crime rate per 100,000 people in St. Paul is 5,414.5 / 100k people.
The violent crime rate per 100,000 people in St. Paul is 766.4 / 100k people.
The property crime rate per 100,000 people in St. Paul is 4,648.1 / 100k people.
Overall, crime in St. Paul is 132.96% above the national average.
Total Crimes
Above National Average
Crime In St. Paul Comparison Table
| Statistic | Count Raw |
St. Paul / 100k People |
Minnesota / 100k People |
National / 100k People |
|---|---|---|---|---|
| Total Crimes Per 100K | 15,027 | 5,414.5 | 2,402.4 | 2,324.2 |
| Violent Crime | 2,127 | 766.4 | 277.5 | 369.8 |
| Murder | 34 | 12.3 | 3.4 | 6.3 |
| Robbery | 413 | 148.8 | 68.5 | 66.1 |
| Aggravated Assault | 1,438 | 518.1 | 166.5 | 268.2 |
| Property Crime | 12,900 | 4,648.1 | 2,124.9 | 1,954.4 |
| Burglary | 1,505 | 542.3 | 307.0 | 269.8 |
| Larceny | 8,206 | 2,956.8 | 1,567.8 | 1,401.9 |
| Car Theft | 3,189 | 1,149.1 | 250.0 | 282.7 |
St. Paul, MN Cost Of Living
Cost of living in St. Paul summary. We use data on the cost of living to determine how expensive it is to live in St. Paul. Real estate prices drive most of the variance in cost of living around Minnesota. Key points include:
The cost of living in St. Paul is 99 with 100 being average.
The cost of living in St. Paul is 1.0x lower than the national average.
The median home value in St. Paul is $278,672.
The median income in St. Paul is $69,919.
St. Paul's Overall Cost Of Living
Lower Than The National Average
Cost Of Living In St. Paul Comparison Table
| Living Expense | St. Paul | Minnesota | National Average | |
|---|---|---|---|---|
| Overall | 99 | 95 | 100 | |
| Services | 102 | 101 | 100 | |
| Groceries | 93 | 98 | 100 | |
| Health | 106 | 111 | 100 | |
| Housing | 96 | 83 | 100 | |
| Transportation | 102 | 98 | 100 | |
| Utilities | 97 | 95 | 100 | |
St. Paul, MN Weather
The average high in St. Paul is 55.4° and the average low is 36.9°.
There are 61.3 days of precipitation each year.
Expect an average of 32.5 inches of precipitation each year with 51.0 inches of snow.
| Stat | St. Paul |
|---|---|
| Average Annual High | 55.4 |
| Average Annual Low | 36.9 |
| Annual Precipitation Days | 61.3 |
| Average Annual Precipitation | 32.5 |
| Average Annual Snowfall | 51.0 |
Average High
Days of Rain
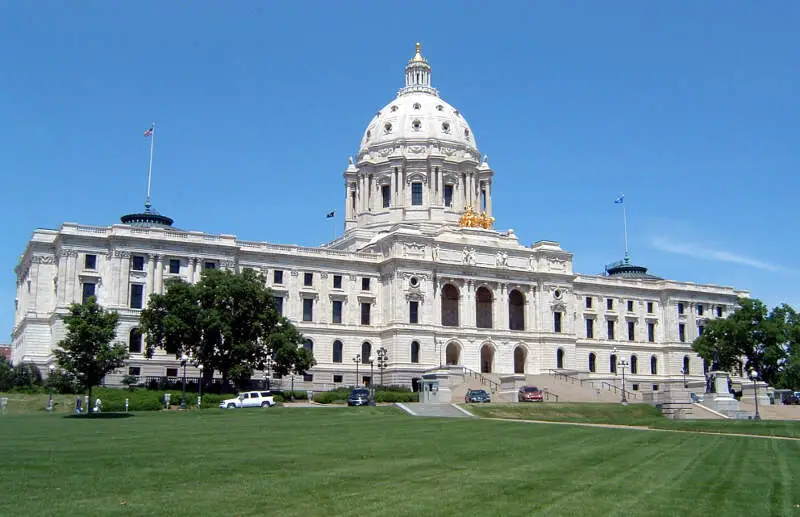
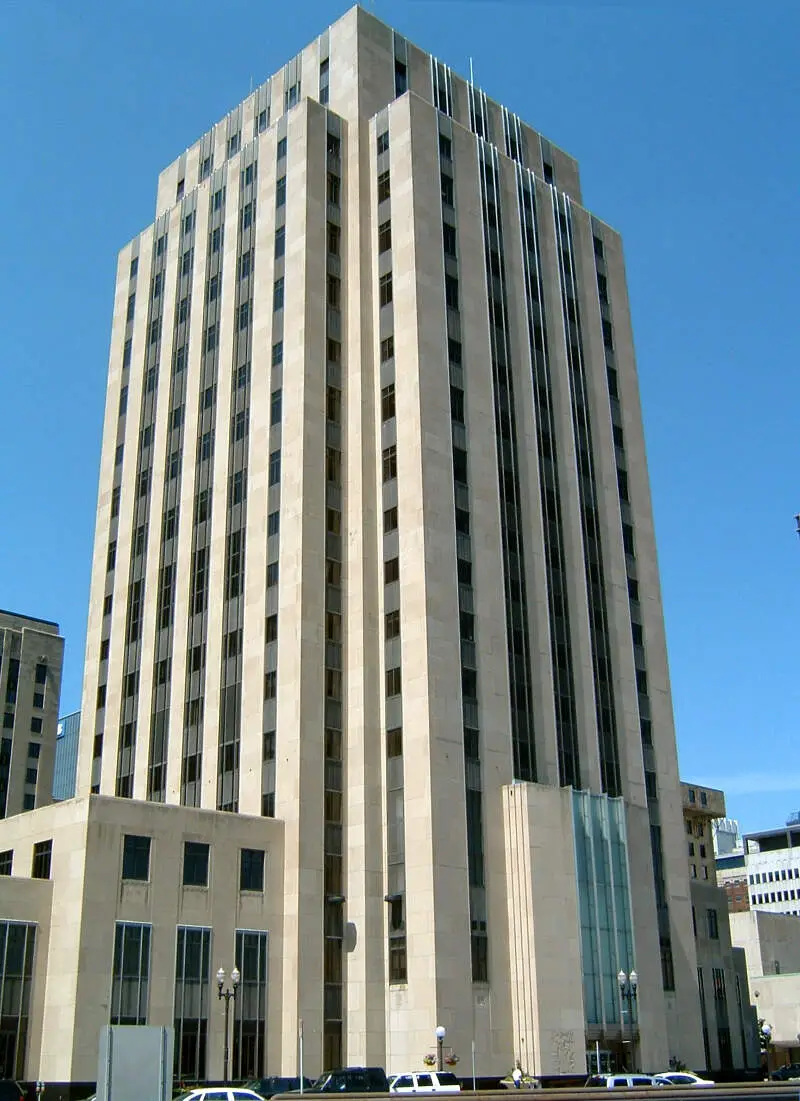
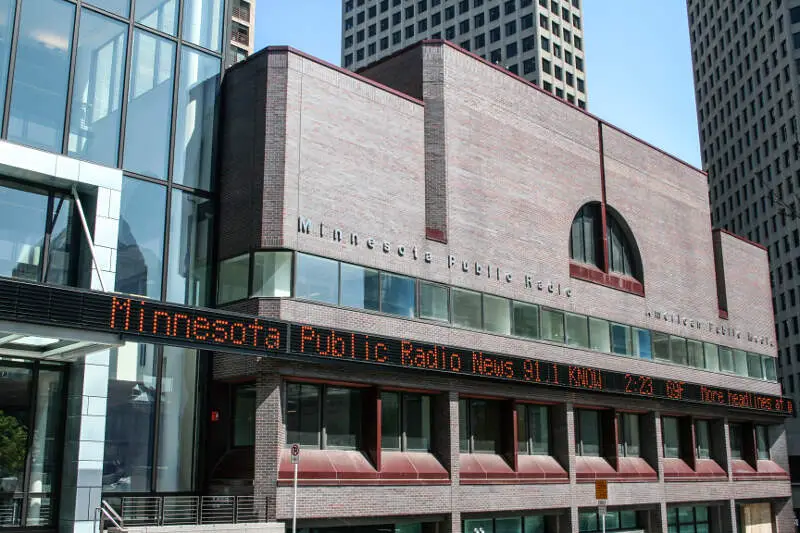
St. Paul, MN Photos


2 Reviews & Comments About St. Paul
/5

Deez Nutz In Your Motherfuckin Mouth Bitch -
I was born and raised in St. Paul but I've been everywhere in this country and I can say MN ain't s**t!! Worst place in MN is the Northside/Southside Minneapolis.
I've been to Harlem, Philly, Brooklyn,L.A., Baltimore,Dallas, Miami, Memphis,Las Vegas, Detroit, Chicago, Fresno, Cleveland, both of the KC's and all these places are way worse than Minneapolis/st.paul, and the whole state lol.
We have it good in MN pretty much all the crime other than the cities are just a bunch of suburban m**h heads lookin to steal your car radio. But the killing is at a minimum in the whole state which is good but I hate how people say Minneapolis and st.paul is ghetto af because it's not.
It's a little ghetto but not nearly as bad as a lot of other places.
HomeSnacks User - 2019-05-09 06:20:08.617078
The weather s***s! It's now May, and we have snow up north-! Winters are freezing cold, summers are super hot with mosquitoes, the State bird! Taxes are ridiculous and the roads have potholes the size of Texas!
Stillwater is a beautiful city on the river, with lots of cute shops and restaurants, which is worth your trip!
St. Paul Articles


Rankings for St. Paul in Minnesota
Locations Around St. Paul
Map Of St. Paul, MN
Best Places Around St. Paul
Edina, MN
Population 53,037
Shoreview, MN
Population 26,846
Plymouth, MN
Population 79,918
Eden Prairie, MN
Population 63,623
Mahtomedi, MN
Population 8,073
Woodbury, MN
Population 75,549
Minnetonka, MN
Population 53,529
Lakeville, MN
Population 70,696
Mendota Heights, MN
Population 11,642
Apple Valley, MN
Population 55,594
St. Paul Demographics And Statistics
Population over time in St. Paul
The current population in St. Paul is 308,806. The population has increased 9.5% from 2010.
| Year | Population | % Change |
|---|---|---|
| 2022 | 308,806 | 2.0% |
| 2021 | 302,760 | 0.6% |
| 2020 | 300,820 | 1.2% |
| 2019 | 297,160 | 0.7% |
| 2018 | 295,043 | 1.1% |
| 2017 | 291,728 | 1.0% |
| 2016 | 288,802 | 0.9% |
| 2015 | 286,171 | 0.8% |
| 2014 | 283,991 | 0.7% |
| 2013 | 282,079 | - |
Race / Ethnicity in St. Paul
St. Paul is:
51.3% White with 158,377 White residents.
15.4% African American with 47,538 African American residents.
0.5% American Indian with 1,552 American Indian residents.
18.3% Asian with 56,453 Asian residents.
0.0% Hawaiian with 73 Hawaiian residents.
0.3% Other with 1,018 Other residents.
5.6% Two Or More with 17,261 Two Or More residents.
8.6% Hispanic with 26,534 Hispanic residents.
| Race | St. Paul | MN | USA |
|---|---|---|---|
| White | 51.3% | 77.7% | 58.9% |
| African American | 15.4% | 6.6% | 12.1% |
| American Indian | 0.5% | 0.8% | 0.6% |
| Asian | 18.3% | 5.0% | 5.7% |
| Hawaiian | 0.0% | 0.0% | 0.2% |
| Other | 0.3% | 0.4% | 0.4% |
| Two Or More | 5.6% | 3.8% | 3.5% |
| Hispanic | 8.6% | 5.7% | 18.7% |
Gender in St. Paul
St. Paul is 50.5% female with 155,984 female residents.
St. Paul is 49.5% male with 152,822 male residents.
| Gender | St. Paul | MN | USA |
|---|---|---|---|
| Female | 50.5% | 49.8% | 50.4% |
| Male | 49.5% | 50.2% | 49.6% |
Highest level of educational attainment in St. Paul for adults over 25
6.0% of adults in St. Paul completed < 9th grade.
5.0% of adults in St. Paul completed 9-12th grade.
21.0% of adults in St. Paul completed high school / ged.
17.0% of adults in St. Paul completed some college.
8.0% of adults in St. Paul completed associate's degree.
25.0% of adults in St. Paul completed bachelor's degree.
12.0% of adults in St. Paul completed master's degree.
3.0% of adults in St. Paul completed professional degree.
3.0% of adults in St. Paul completed doctorate degree.
| Education | St. Paul | MN | USA |
|---|---|---|---|
| < 9th Grade | 6.0% | 2.0% | 4.0% |
| 9-12th Grade | 5.0% | 4.0% | 6.0% |
| High School / GED | 21.0% | 24.0% | 26.0% |
| Some College | 17.0% | 20.0% | 20.0% |
| Associate's Degree | 8.0% | 12.0% | 9.0% |
| Bachelor's Degree | 25.0% | 25.0% | 21.0% |
| Master's Degree | 12.0% | 9.0% | 10.0% |
| Professional Degree | 3.0% | 2.0% | 2.0% |
| Doctorate Degree | 3.0% | 2.0% | 2.0% |
Household Income For St. Paul, Minnesota
5.3% of households in St. Paul earn Less than $10,000.
4.3% of households in St. Paul earn $10,000 to $14,999.
6.9% of households in St. Paul earn $15,000 to $24,999.
7.7% of households in St. Paul earn $25,000 to $34,999.
11.3% of households in St. Paul earn $35,000 to $49,999.
17.8% of households in St. Paul earn $50,000 to $74,999.
12.1% of households in St. Paul earn $75,000 to $99,999.
16.0% of households in St. Paul earn $100,000 to $149,999.
8.8% of households in St. Paul earn $150,000 to $199,999.
9.7% of households in St. Paul earn $200,000 or more.
| Income | St. Paul | MN | USA |
|---|---|---|---|
| Less than $10,000 | 5.3% | 3.6% | 4.9% |
| $10,000 to $14,999 | 4.3% | 3.0% | 3.8% |
| $15,000 to $24,999 | 6.9% | 5.8% | 7.0% |
| $25,000 to $34,999 | 7.7% | 6.3% | 7.4% |
| $35,000 to $49,999 | 11.3% | 9.9% | 10.7% |
| $50,000 to $74,999 | 17.8% | 16.1% | 16.1% |
| $75,000 to $99,999 | 12.1% | 13.6% | 12.8% |
| $100,000 to $149,999 | 16.0% | 19.6% | 17.1% |
| $150,000 to $199,999 | 8.8% | 10.4% | 8.8% |
| $200,000 or more | 9.7% | 11.9% | 11.4% |


