Branson, MO
Demographics And Statistics
Living In Branson, Missouri Summary
Life in Branson research summary. HomeSnacks has been using Saturday Night Science to research the quality of life in Branson over the past nine years using Census, FBI, Zillow, and other primary data sources. Based on the most recently available data, we found the following about life in Branson:
The population in Branson is 12,651.
The median home value in Branson is $261,481.
The median income in Branson is $49,790.
The cost of living in Branson is 88 which is 0.9x lower than the national average.
The median rent in Branson is $916.
The unemployment rate in Branson is 4.0%.
The poverty rate in Branson is 26.8%.
The average high in Branson is 69.0° and the average low is 44.0°.
Branson SnackAbility
Overall SnackAbility
Branson, MO Crime Report
Crime in Branson summary. We use data from the FBI to determine the crime rates in Branson. Key points include:
There were 872 total crimes in Branson in the last reporting year.
The overall crime rate per 100,000 people in Branson is 6,696.9 / 100k people.
The violent crime rate per 100,000 people in Branson is 453.1 / 100k people.
The property crime rate per 100,000 people in Branson is 6,243.8 / 100k people.
Overall, crime in Branson is 188.14% above the national average.
Total Crimes
Above National Average
Crime In Branson Comparison Table
| Statistic | Count Raw |
Branson / 100k People |
Missouri / 100k People |
National / 100k People |
|---|---|---|---|---|
| Total Crimes Per 100K | 872 | 6,696.9 | 3,073.7 | 2,324.2 |
| Violent Crime | 59 | 453.1 | 542.7 | 369.8 |
| Murder | 0 | 0.0 | 11.8 | 6.3 |
| Robbery | 7 | 53.8 | 74.4 | 66.1 |
| Aggravated Assault | 34 | 261.1 | 413.3 | 268.2 |
| Property Crime | 813 | 6,243.8 | 2,531.0 | 1,954.4 |
| Burglary | 53 | 407.0 | 378.8 | 269.8 |
| Larceny | 698 | 5,360.6 | 1,759.1 | 1,401.9 |
| Car Theft | 62 | 476.2 | 393.2 | 282.7 |
Branson, MO Cost Of Living
Cost of living in Branson summary. We use data on the cost of living to determine how expensive it is to live in Branson. Real estate prices drive most of the variance in cost of living around Missouri. Key points include:
The cost of living in Branson is 88 with 100 being average.
The cost of living in Branson is 0.9x lower than the national average.
The median home value in Branson is $261,481.
The median income in Branson is $49,790.
Branson's Overall Cost Of Living
Lower Than The National Average
Cost Of Living In Branson Comparison Table
| Living Expense | Branson | Missouri | National Average | |
|---|---|---|---|---|
| Overall | 88 | 89 | 100 | |
| Services | 91 | 92 | 100 | |
| Groceries | 98 | 96 | 100 | |
| Health | 97 | 88 | 100 | |
| Housing | 84 | 79 | 100 | |
| Transportation | 89 | 95 | 100 | |
| Utilities | 85 | 95 | 100 | |
Branson, MO Weather
The average high in Branson is 69.0° and the average low is 44.0°.
There are 69.6 days of precipitation each year.
Expect an average of 44.3 inches of precipitation each year with 8.1 inches of snow.
| Stat | Branson |
|---|---|
| Average Annual High | 69.0 |
| Average Annual Low | 44.0 |
| Annual Precipitation Days | 69.6 |
| Average Annual Precipitation | 44.3 |
| Average Annual Snowfall | 8.1 |
Average High
Days of Rain
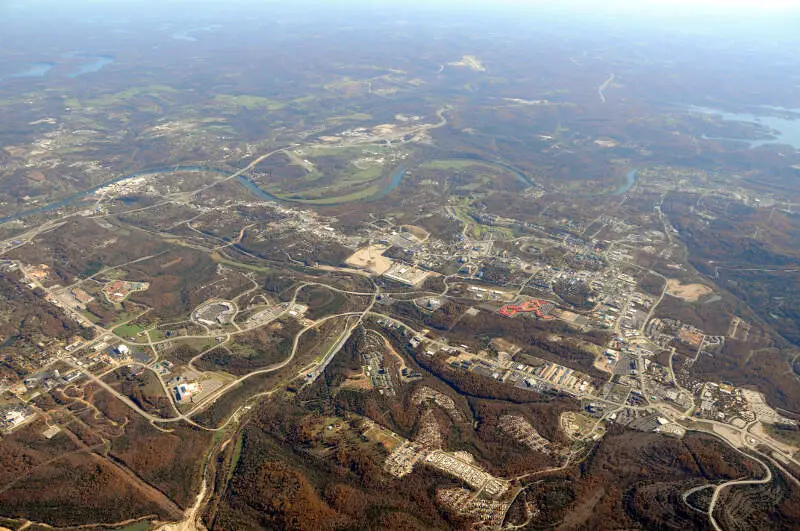
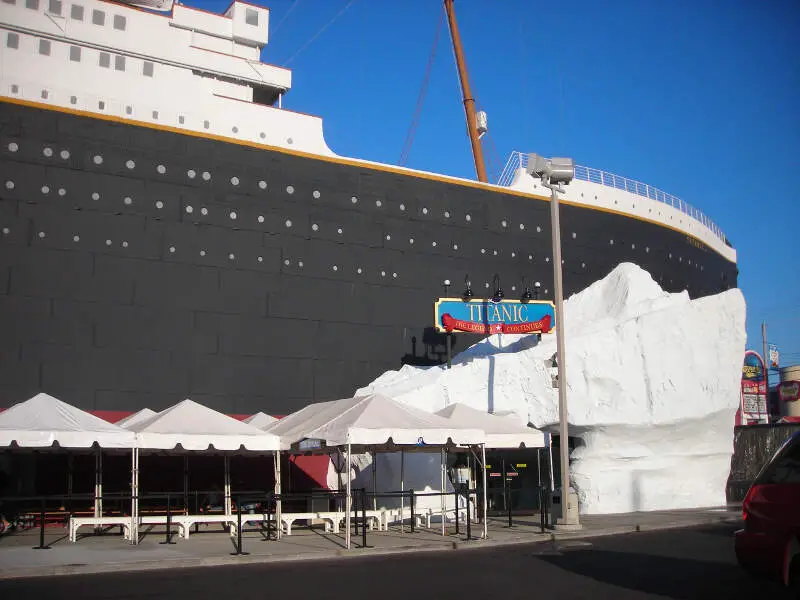
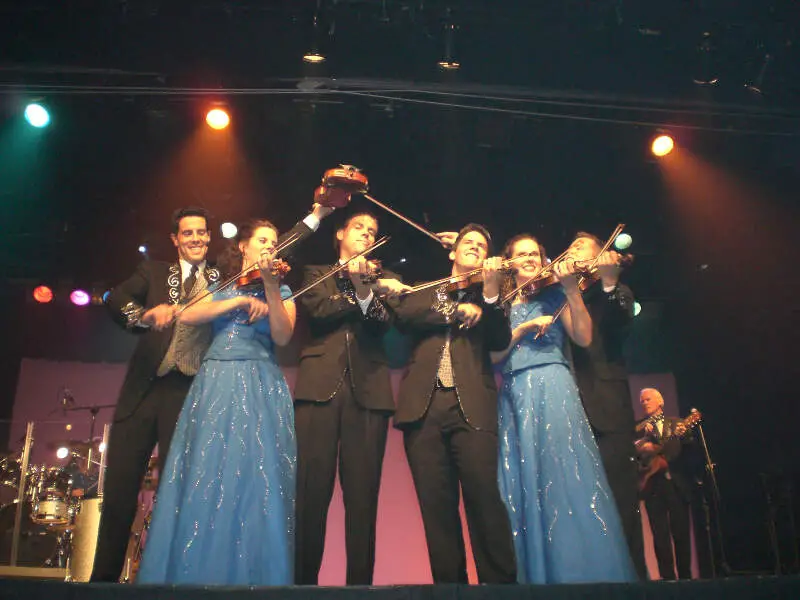
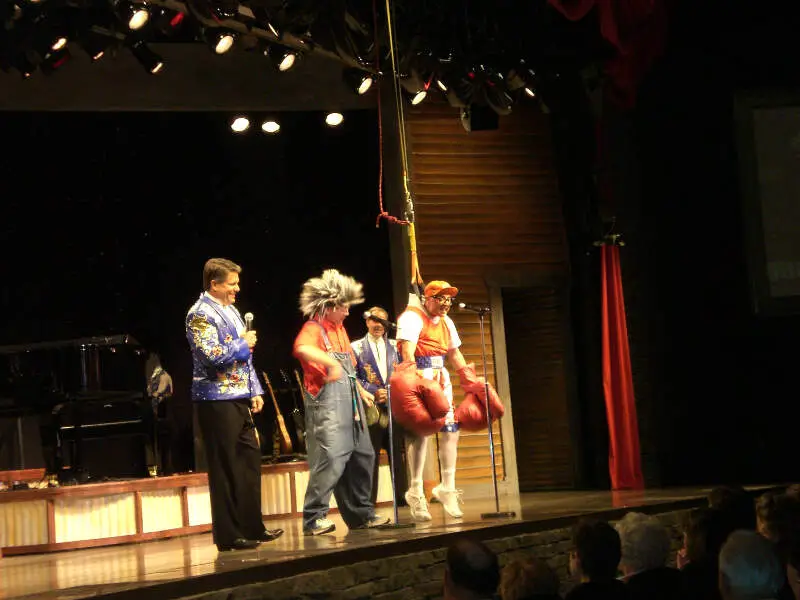
Branson, MO Photos
4 Reviews & Comments About Branson
/5

HomeSnacks User - 2018-07-15 17:56:39.098291
Branson, MO is a good place to go on a vacation if you are looking for a place that is good, clean fun. There are local and national music shows and concerts in all of the theaters on the strip, lots of good places to eat, and nice motel rooms at very reasonable prices. There is no crime to speak of, and everything you could want to do is well within walking distance of your motel.
Local shows, concerts by famous artists, good food, and lots of places to shop.
HomeSnacks User - 2018-08-04 21:32:56.666862
I love Branson Mo. It is a fun town It has great restaurants, shows, amusement parks and places to stay. We go every year and love it.
We stay at Westgate Branson Woods in a 2 bedroom condo. The place is clean and well appointed. The bad thing this trip was the Ride the Duck accident that happened a week before we arrived so everyone was blue. Bad prices are creeping up not as reasonable as it use to be.
HomeSnacks User - 2018-08-27 18:46:51.333599
Branson is the ultimate Missouri getaway destination. It is a beautiful city with so much to do. The locals are very friendly and knowledgeable about their local tourist attractions.
My favorite place to visit is the Dolly Parton Stampede. The show is amazing and the food is absolutely scrumptious. Definitely a "must see" attraction!
HomeSnacks User -
I hate to be the bearer of bad news here, but yes Branson is that bad. You just don't hear about it because the city council won't allow it in local papers or news.
Spend a couple of days at court in Branson or better yet, sit in with Judge Williams over at Taney county where Branson sends most of it's cases.
Rankings for Branson in Missouri


Locations Around Branson
Map Of Branson, MO
Best Places Around Branson
Battlefield, MO
Population 6,046
Nixa, MO
Population 23,523
Willard, MO
Population 6,342
Ozark, MO
Population 21,459
Monett, MO
Population 9,632
Republic, MO
Population 18,824
Aurora, MO
Population 7,290
Berryville, AR
Population 5,667
Harrison, AR
Population 13,154
Branson Demographics And Statistics
Population over time in Branson
The current population in Branson is 12,651. The population has increased 28.4% from 2010.
| Year | Population | % Change |
|---|---|---|
| 2022 | 12,651 | 11.5% |
| 2021 | 11,345 | 1.0% |
| 2020 | 11,228 | 0.6% |
| 2019 | 11,158 | 0.7% |
| 2018 | 11,084 | 1.3% |
| 2017 | 10,942 | 1.9% |
| 2016 | 10,741 | 2.7% |
| 2015 | 10,463 | 2.7% |
| 2014 | 10,185 | 3.4% |
| 2013 | 9,854 | - |
Race / Ethnicity in Branson
Branson is:
81.3% White with 10,287 White residents.
5.1% African American with 642 African American residents.
0.3% American Indian with 34 American Indian residents.
2.9% Asian with 368 Asian residents.
0.0% Hawaiian with 0 Hawaiian residents.
0.7% Other with 84 Other residents.
1.2% Two Or More with 158 Two Or More residents.
8.5% Hispanic with 1,078 Hispanic residents.
| Race | Branson | MO | USA |
|---|---|---|---|
| White | 81.3% | 77.6% | 58.9% |
| African American | 5.1% | 11.2% | 12.1% |
| American Indian | 0.3% | 0.2% | 0.6% |
| Asian | 2.9% | 2.0% | 5.7% |
| Hawaiian | 0.0% | 0.1% | 0.2% |
| Other | 0.7% | 0.3% | 0.4% |
| Two Or More | 1.2% | 4.0% | 3.5% |
| Hispanic | 8.5% | 4.6% | 18.7% |
Gender in Branson
Branson is 57.5% female with 7,267 female residents.
Branson is 42.5% male with 5,383 male residents.
| Gender | Branson | MO | USA |
|---|---|---|---|
| Female | 57.5% | 50.6% | 50.4% |
| Male | 42.5% | 49.4% | 49.6% |
Highest level of educational attainment in Branson for adults over 25
2.0% of adults in Branson completed < 9th grade.
9.0% of adults in Branson completed 9-12th grade.
28.0% of adults in Branson completed high school / ged.
30.0% of adults in Branson completed some college.
4.0% of adults in Branson completed associate's degree.
20.0% of adults in Branson completed bachelor's degree.
4.0% of adults in Branson completed master's degree.
2.0% of adults in Branson completed professional degree.
1.0% of adults in Branson completed doctorate degree.
| Education | Branson | MO | USA |
|---|---|---|---|
| < 9th Grade | 2.0% | 4.0% | 4.0% |
| 9-12th Grade | 9.0% | 6.0% | 6.0% |
| High School / GED | 28.0% | 30.0% | 26.0% |
| Some College | 30.0% | 21.0% | 20.0% |
| Associate's Degree | 4.0% | 8.0% | 9.0% |
| Bachelor's Degree | 20.0% | 19.0% | 21.0% |
| Master's Degree | 4.0% | 9.0% | 10.0% |
| Professional Degree | 2.0% | 2.0% | 2.0% |
| Doctorate Degree | 1.0% | 1.0% | 2.0% |
Household Income For Branson, Missouri
8.3% of households in Branson earn Less than $10,000.
6.8% of households in Branson earn $10,000 to $14,999.
11.2% of households in Branson earn $15,000 to $24,999.
7.5% of households in Branson earn $25,000 to $34,999.
16.5% of households in Branson earn $35,000 to $49,999.
21.1% of households in Branson earn $50,000 to $74,999.
12.5% of households in Branson earn $75,000 to $99,999.
8.6% of households in Branson earn $100,000 to $149,999.
4.5% of households in Branson earn $150,000 to $199,999.
3.1% of households in Branson earn $200,000 or more.
| Income | Branson | MO | USA |
|---|---|---|---|
| Less than $10,000 | 8.3% | 5.0% | 4.9% |
| $10,000 to $14,999 | 6.8% | 4.3% | 3.8% |
| $15,000 to $24,999 | 11.2% | 8.0% | 7.0% |
| $25,000 to $34,999 | 7.5% | 8.6% | 7.4% |
| $35,000 to $49,999 | 16.5% | 12.3% | 10.7% |
| $50,000 to $74,999 | 21.1% | 17.7% | 16.1% |
| $75,000 to $99,999 | 12.5% | 13.4% | 12.8% |
| $100,000 to $149,999 | 8.6% | 16.1% | 17.1% |
| $150,000 to $199,999 | 4.5% | 7.2% | 8.8% |
| $200,000 or more | 3.1% | 7.3% | 11.4% |


