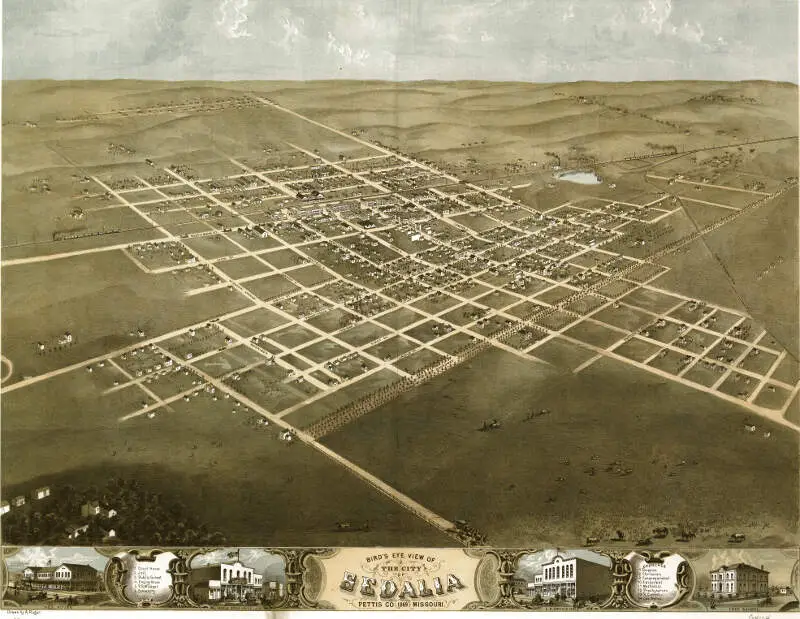
Sedalia, MO
Demographics And Statistics
Living In Sedalia, Missouri Summary
Life in Sedalia research summary. HomeSnacks has been using Saturday Night Science to research the quality of life in Sedalia over the past nine years using Census, FBI, Zillow, and other primary data sources. Based on the most recently available data, we found the following about life in Sedalia:
The population in Sedalia is 21,767.
The median home value in Sedalia is $166,522.
The median income in Sedalia is $48,518.
The median rent in Sedalia is $825.
The unemployment rate in Sedalia is 5.4%.
The poverty rate in Sedalia is 17.6%.
The average high in Sedalia is 65.4° and the average low is 44.2°.
Sedalia SnackAbility
Overall SnackAbility
Sedalia, MO Crime Report
Crime in Sedalia summary. We use data from the FBI to determine the crime rates in Sedalia. Key points include:
There were 725 total crimes in Sedalia in the last reporting year.
The overall crime rate per 100,000 people in Sedalia is 3,306.9 / 100k people.
The violent crime rate per 100,000 people in Sedalia is 492.6 / 100k people.
The property crime rate per 100,000 people in Sedalia is 2,814.3 / 100k people.
Overall, crime in Sedalia is 42.28% above the national average.
Total Crimes
Above National Average
Crime In Sedalia Comparison Table
| Statistic | Count Raw |
Sedalia / 100k People |
Missouri / 100k People |
National / 100k People |
|---|---|---|---|---|
| Total Crimes Per 100K | 725 | 3,306.9 | 3,073.7 | 2,324.2 |
| Violent Crime | 108 | 492.6 | 542.7 | 369.8 |
| Murder | 0 | 0.0 | 11.8 | 6.3 |
| Robbery | 7 | 31.9 | 74.4 | 66.1 |
| Aggravated Assault | 73 | 333.0 | 413.3 | 268.2 |
| Property Crime | 617 | 2,814.3 | 2,531.0 | 1,954.4 |
| Burglary | 131 | 597.5 | 378.8 | 269.8 |
| Larceny | 429 | 1,956.8 | 1,759.1 | 1,401.9 |
| Car Theft | 57 | 260.0 | 393.2 | 282.7 |
Sedalia, MO Weather
The average high in Sedalia is 65.4° and the average low is 44.2°.
There are 68.6 days of precipitation each year.
Expect an average of 43.7 inches of precipitation each year with 12.0 inches of snow.
| Stat | Sedalia |
|---|---|
| Average Annual High | 65.4 |
| Average Annual Low | 44.2 |
| Annual Precipitation Days | 68.6 |
| Average Annual Precipitation | 43.7 |
| Average Annual Snowfall | 12.0 |
Average High
Days of Rain
Sedalia, MO Photos


Rankings for Sedalia in Missouri


Locations Around Sedalia
Map Of Sedalia, MO
Best Places Around Sedalia
Warrensburg, MO
Population 19,317
Odessa, MO
Population 5,554
Marshall, MO
Population 13,687
Boonville, MO
Population 7,725
Clinton, MO
Population 8,908
Jamestown, ND
Population 15,850
Sedalia Demographics And Statistics
Population over time in Sedalia
The current population in Sedalia is 21,767. The population has increased 3.0% from 2010.
| Year | Population | % Change |
|---|---|---|
| 2022 | 21,767 | 0.6% |
| 2021 | 21,642 | 0.8% |
| 2020 | 21,477 | 0.2% |
| 2019 | 21,441 | -0.1% |
| 2018 | 21,457 | 0.1% |
| 2017 | 21,429 | 0.1% |
| 2016 | 21,402 | 0.3% |
| 2015 | 21,340 | 0.5% |
| 2014 | 21,236 | 0.4% |
| 2013 | 21,142 | - |
Race / Ethnicity in Sedalia
Sedalia is:
75.4% White with 16,408 White residents.
4.4% African American with 968 African American residents.
0.0% American Indian with 10 American Indian residents.
1.0% Asian with 216 Asian residents.
0.1% Hawaiian with 13 Hawaiian residents.
0.4% Other with 82 Other residents.
4.9% Two Or More with 1,063 Two Or More residents.
13.8% Hispanic with 3,007 Hispanic residents.
| Race | Sedalia | MO | USA |
|---|---|---|---|
| White | 75.4% | 77.6% | 58.9% |
| African American | 4.4% | 11.2% | 12.1% |
| American Indian | 0.0% | 0.2% | 0.6% |
| Asian | 1.0% | 2.0% | 5.7% |
| Hawaiian | 0.1% | 0.1% | 0.2% |
| Other | 0.4% | 0.3% | 0.4% |
| Two Or More | 4.9% | 4.0% | 3.5% |
| Hispanic | 13.8% | 4.6% | 18.7% |
Gender in Sedalia
Sedalia is 51.2% female with 11,140 female residents.
Sedalia is 48.8% male with 10,626 male residents.
| Gender | Sedalia | MO | USA |
|---|---|---|---|
| Female | 51.2% | 50.6% | 50.4% |
| Male | 48.8% | 49.4% | 49.6% |
Highest level of educational attainment in Sedalia for adults over 25
4.0% of adults in Sedalia completed < 9th grade.
10.0% of adults in Sedalia completed 9-12th grade.
36.0% of adults in Sedalia completed high school / ged.
22.0% of adults in Sedalia completed some college.
11.0% of adults in Sedalia completed associate's degree.
11.0% of adults in Sedalia completed bachelor's degree.
5.0% of adults in Sedalia completed master's degree.
0.0% of adults in Sedalia completed professional degree.
1.0% of adults in Sedalia completed doctorate degree.
| Education | Sedalia | MO | USA |
|---|---|---|---|
| < 9th Grade | 4.0% | 4.0% | 4.0% |
| 9-12th Grade | 10.0% | 6.0% | 6.0% |
| High School / GED | 36.0% | 30.0% | 26.0% |
| Some College | 22.0% | 21.0% | 20.0% |
| Associate's Degree | 11.0% | 8.0% | 9.0% |
| Bachelor's Degree | 11.0% | 19.0% | 21.0% |
| Master's Degree | 5.0% | 9.0% | 10.0% |
| Professional Degree | 0.0% | 2.0% | 2.0% |
| Doctorate Degree | 1.0% | 1.0% | 2.0% |
Household Income For Sedalia, Missouri
5.5% of households in Sedalia earn Less than $10,000.
6.0% of households in Sedalia earn $10,000 to $14,999.
11.2% of households in Sedalia earn $15,000 to $24,999.
12.2% of households in Sedalia earn $25,000 to $34,999.
16.5% of households in Sedalia earn $35,000 to $49,999.
19.1% of households in Sedalia earn $50,000 to $74,999.
11.5% of households in Sedalia earn $75,000 to $99,999.
11.4% of households in Sedalia earn $100,000 to $149,999.
3.8% of households in Sedalia earn $150,000 to $199,999.
2.9% of households in Sedalia earn $200,000 or more.
| Income | Sedalia | MO | USA |
|---|---|---|---|
| Less than $10,000 | 5.5% | 5.0% | 4.9% |
| $10,000 to $14,999 | 6.0% | 4.3% | 3.8% |
| $15,000 to $24,999 | 11.2% | 8.0% | 7.0% |
| $25,000 to $34,999 | 12.2% | 8.6% | 7.4% |
| $35,000 to $49,999 | 16.5% | 12.3% | 10.7% |
| $50,000 to $74,999 | 19.1% | 17.7% | 16.1% |
| $75,000 to $99,999 | 11.5% | 13.4% | 12.8% |
| $100,000 to $149,999 | 11.4% | 16.1% | 17.1% |
| $150,000 to $199,999 | 3.8% | 7.2% | 8.8% |
| $200,000 or more | 2.9% | 7.3% | 11.4% |


