Springfield, MO
Demographics And Statistics
Living In Springfield, Missouri Summary
Life in Springfield research summary. HomeSnacks has been using Saturday Night Science to research the quality of life in Springfield over the past nine years using Census, FBI, Zillow, and other primary data sources. Based on the most recently available data, we found the following about life in Springfield:
The population in Springfield is 168,873.
The median home value in Springfield is $222,322.
The median income in Springfield is $43,450.
The cost of living in Springfield is 84 which is 0.8x lower than the national average.
The median rent in Springfield is $878.
The unemployment rate in Springfield is 4.8%.
The poverty rate in Springfield is 20.3%.
The average high in Springfield is 66.6° and the average low is 44.4°.
Springfield SnackAbility
Overall SnackAbility
Springfield, MO Crime Report
Crime in Springfield summary. We use data from the FBI to determine the crime rates in Springfield. Key points include:
There were 10,744 total crimes in Springfield in the last reporting year.
The overall crime rate per 100,000 people in Springfield is 6,326.6 / 100k people.
The violent crime rate per 100,000 people in Springfield is 1,418.0 / 100k people.
The property crime rate per 100,000 people in Springfield is 4,908.7 / 100k people.
Overall, crime in Springfield is 172.21% above the national average.
Total Crimes
Above National Average
Crime In Springfield Comparison Table
| Statistic | Count Raw |
Springfield / 100k People |
Missouri / 100k People |
National / 100k People |
|---|---|---|---|---|
| Total Crimes Per 100K | 10,744 | 6,326.6 | 3,073.7 | 2,324.2 |
| Violent Crime | 2,408 | 1,418.0 | 542.7 | 369.8 |
| Murder | 17 | 10.0 | 11.8 | 6.3 |
| Robbery | 309 | 182.0 | 74.4 | 66.1 |
| Aggravated Assault | 1,892 | 1,114.1 | 413.3 | 268.2 |
| Property Crime | 8,336 | 4,908.7 | 2,531.0 | 1,954.4 |
| Burglary | 1,368 | 805.5 | 378.8 | 269.8 |
| Larceny | 5,819 | 3,426.5 | 1,759.1 | 1,401.9 |
| Car Theft | 1,149 | 676.6 | 393.2 | 282.7 |
Springfield, MO Cost Of Living
Cost of living in Springfield summary. We use data on the cost of living to determine how expensive it is to live in Springfield. Real estate prices drive most of the variance in cost of living around Missouri. Key points include:
The cost of living in Springfield is 84 with 100 being average.
The cost of living in Springfield is 0.8x lower than the national average.
The median home value in Springfield is $222,322.
The median income in Springfield is $43,450.
Springfield's Overall Cost Of Living
Lower Than The National Average
Cost Of Living In Springfield Comparison Table
| Living Expense | Springfield | Missouri | National Average | |
|---|---|---|---|---|
| Overall | 84 | 89 | 100 | |
| Services | 90 | 92 | 100 | |
| Groceries | 96 | 96 | 100 | |
| Health | 99 | 88 | 100 | |
| Housing | 62 | 79 | 100 | |
| Transportation | 87 | 95 | 100 | |
| Utilities | 88 | 95 | 100 | |
Springfield, MO Weather
The average high in Springfield is 66.6° and the average low is 44.4°.
There are 66.6 days of precipitation each year.
Expect an average of 45.1 inches of precipitation each year with 13.3 inches of snow.
| Stat | Springfield |
|---|---|
| Average Annual High | 66.6 |
| Average Annual Low | 44.4 |
| Annual Precipitation Days | 66.6 |
| Average Annual Precipitation | 45.1 |
| Average Annual Snowfall | 13.3 |
Average High
Days of Rain
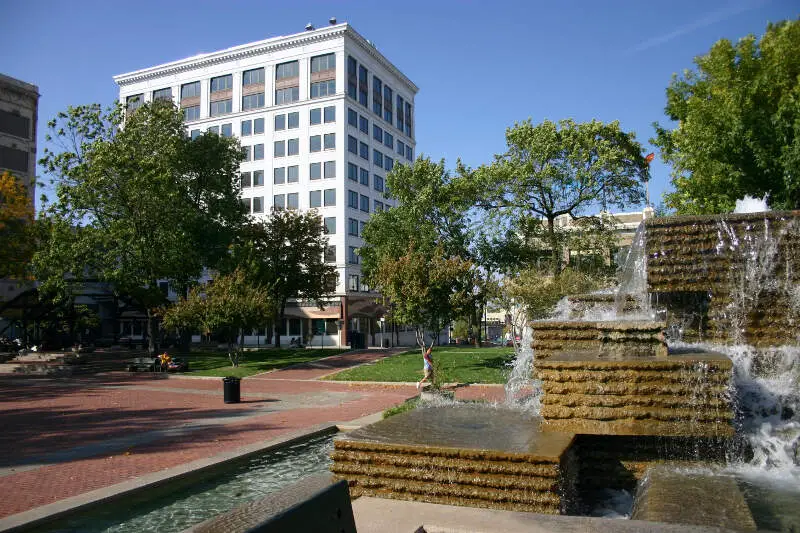
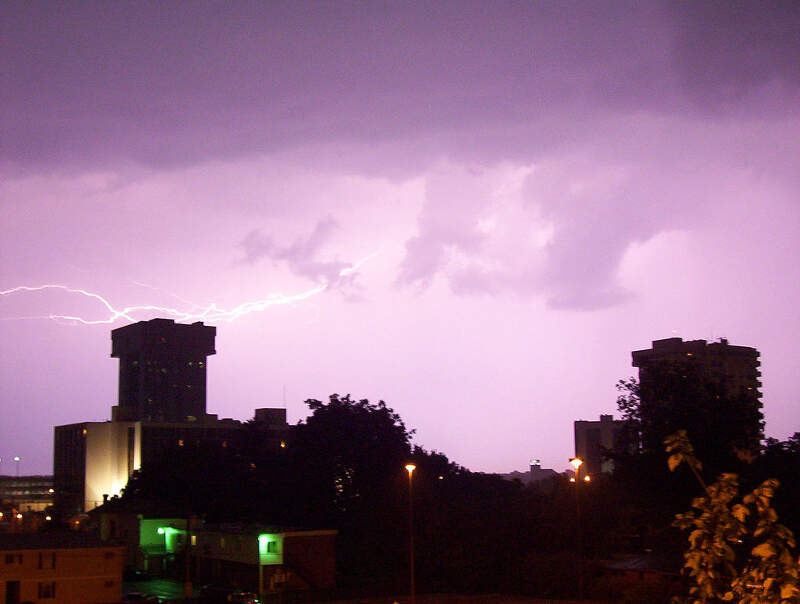
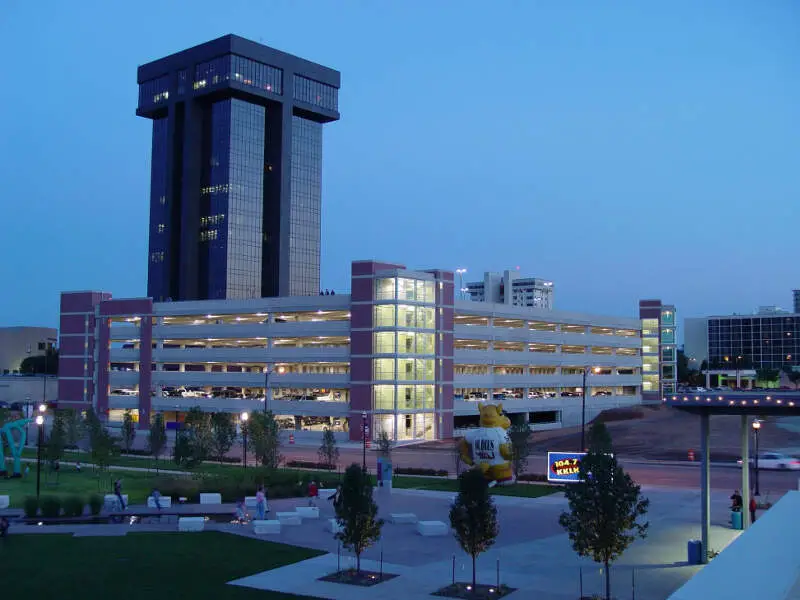
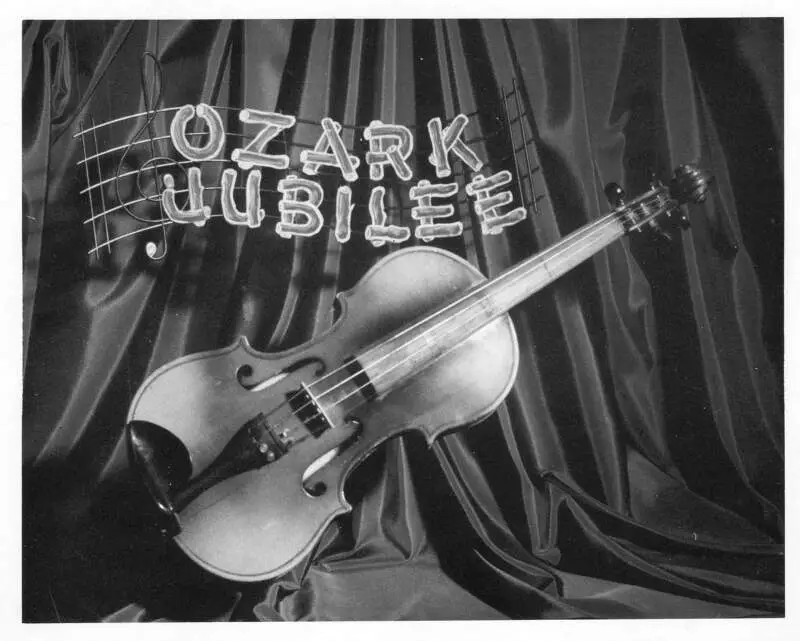
Springfield, MO Photos


2 Reviews & Comments About Springfield
/5

HomeSnacks User - 2019-04-03 00:57:49.273903
The police here pat their selfs on the back every time crime drops 1%. R**e, drug crimes, death by car wrecks is common. Homeless are shipped here from KC. The city council has issues with the north side of town. Very little money is spent there but the south side of town money is poured into it. The mayor lives on the south side.
Lots of good Restaurants to eat at. Sams is good
Lots of small family run businesses. Small towns around Springfield are great to visit. And Flea markets abound
HomeSnacks User - 2019-05-18 22:57:37.316527
The crime here in Springfield is brutal. Drugs, everywhere. Shootings and gangs. The schools are aweful. I was constantly being bullied or set up. I wouldn't ever wish my kids to go through what I did in Springfield schools. Kids are ruthless. Constant wrecks. I've seen so many disturbing wrecks happen right in front of me. I couldn't tell you how many I've seen.
I wouldn't recommend going downtown by yourself. AT ALL.
Rankings for Springfield in Missouri


Locations Around Springfield
Map Of Springfield, MO
Best Places Around Springfield
Battlefield, MO
Population 6,046
Nixa, MO
Population 23,523
Willard, MO
Population 6,342
Ozark, MO
Population 21,459
Republic, MO
Population 18,824
Springfield Demographics And Statistics
Population over time in Springfield
The current population in Springfield is 168,873. The population has increased 6.2% from 2010.
| Year | Population | % Change |
|---|---|---|
| 2022 | 168,873 | 1.3% |
| 2021 | 166,633 | 0.5% |
| 2020 | 165,785 | 0.4% |
| 2019 | 165,138 | 0.8% |
| 2018 | 163,763 | 0.9% |
| 2017 | 162,333 | 0.7% |
| 2016 | 161,189 | 0.6% |
| 2015 | 160,246 | 0.4% |
| 2014 | 159,621 | 0.4% |
| 2013 | 158,945 | - |
Race / Ethnicity in Springfield
Springfield is:
84.1% White with 142,044 White residents.
4.2% African American with 7,170 African American residents.
0.3% American Indian with 506 American Indian residents.
1.8% Asian with 3,107 Asian residents.
0.2% Hawaiian with 372 Hawaiian residents.
0.3% Other with 539 Other residents.
4.4% Two Or More with 7,377 Two Or More residents.
4.6% Hispanic with 7,758 Hispanic residents.
| Race | Springfield | MO | USA |
|---|---|---|---|
| White | 84.1% | 77.6% | 58.9% |
| African American | 4.2% | 11.2% | 12.1% |
| American Indian | 0.3% | 0.2% | 0.6% |
| Asian | 1.8% | 2.0% | 5.7% |
| Hawaiian | 0.2% | 0.1% | 0.2% |
| Other | 0.3% | 0.3% | 0.4% |
| Two Or More | 4.4% | 4.0% | 3.5% |
| Hispanic | 4.6% | 4.6% | 18.7% |
Gender in Springfield
Springfield is 50.9% female with 85,956 female residents.
Springfield is 49.1% male with 82,917 male residents.
| Gender | Springfield | MO | USA |
|---|---|---|---|
| Female | 50.9% | 50.6% | 50.4% |
| Male | 49.1% | 49.4% | 49.6% |
Highest level of educational attainment in Springfield for adults over 25
2.0% of adults in Springfield completed < 9th grade.
6.0% of adults in Springfield completed 9-12th grade.
29.0% of adults in Springfield completed high school / ged.
25.0% of adults in Springfield completed some college.
8.0% of adults in Springfield completed associate's degree.
19.0% of adults in Springfield completed bachelor's degree.
8.0% of adults in Springfield completed master's degree.
2.0% of adults in Springfield completed professional degree.
1.0% of adults in Springfield completed doctorate degree.
| Education | Springfield | MO | USA |
|---|---|---|---|
| < 9th Grade | 2.0% | 4.0% | 4.0% |
| 9-12th Grade | 6.0% | 6.0% | 6.0% |
| High School / GED | 29.0% | 30.0% | 26.0% |
| Some College | 25.0% | 21.0% | 20.0% |
| Associate's Degree | 8.0% | 8.0% | 9.0% |
| Bachelor's Degree | 19.0% | 19.0% | 21.0% |
| Master's Degree | 8.0% | 9.0% | 10.0% |
| Professional Degree | 2.0% | 2.0% | 2.0% |
| Doctorate Degree | 1.0% | 1.0% | 2.0% |
Household Income For Springfield, Missouri
7.0% of households in Springfield earn Less than $10,000.
8.0% of households in Springfield earn $10,000 to $14,999.
11.7% of households in Springfield earn $15,000 to $24,999.
13.9% of households in Springfield earn $25,000 to $34,999.
15.6% of households in Springfield earn $35,000 to $49,999.
18.1% of households in Springfield earn $50,000 to $74,999.
10.8% of households in Springfield earn $75,000 to $99,999.
8.7% of households in Springfield earn $100,000 to $149,999.
3.1% of households in Springfield earn $150,000 to $199,999.
3.0% of households in Springfield earn $200,000 or more.
| Income | Springfield | MO | USA |
|---|---|---|---|
| Less than $10,000 | 7.0% | 5.0% | 4.9% |
| $10,000 to $14,999 | 8.0% | 4.3% | 3.8% |
| $15,000 to $24,999 | 11.7% | 8.0% | 7.0% |
| $25,000 to $34,999 | 13.9% | 8.6% | 7.4% |
| $35,000 to $49,999 | 15.6% | 12.3% | 10.7% |
| $50,000 to $74,999 | 18.1% | 17.7% | 16.1% |
| $75,000 to $99,999 | 10.8% | 13.4% | 12.8% |
| $100,000 to $149,999 | 8.7% | 16.1% | 17.1% |
| $150,000 to $199,999 | 3.1% | 7.2% | 8.8% |
| $200,000 or more | 3.0% | 7.3% | 11.4% |


