
Before you decide to relocate to Kentucky, it’s important to research the exact cost of living around the state. And that’s what we’re going to help you do.
These are the places in Kentucky that cost a pretty penny — the most expensive cities in the state.
We used Saturday Night Science to compare the 2018-2022 American Community Survey on cost of living for the 78 places in Kentucky with more than 5,000 people.
After we saved up for months and could finally afford it, we landed on this list of the ten most expensive cities in Kentucky for 2024.
Table Of Contents: Top Ten | Methodology | Summary | Table
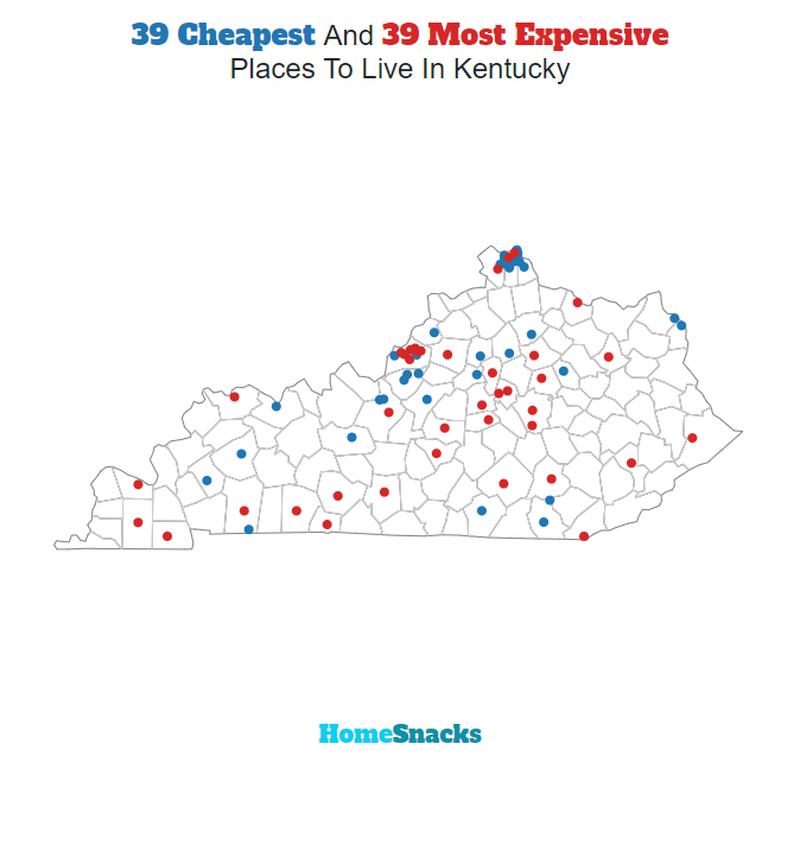
The 10 Most Expensive Places To Live In Kentucky For 2024
What’s the most expensive place to live in Kentucky? Well, HomeSnacks crunched the numbers and discovered that Union is the most expensive place to live in Kentucky.
Williamsburg (the cheapest place to live in Kentucky) can show these guys how to live on a budget in the coming years. Read on for how these places had costs rise faster than inflation.
And if you already knew these places were expensive, check out some more reading about Kentucky and the most expensive cities in the country:
The 10 Most Expensive Places To Live In Kentucky For 2024

/10
Population: 7,369
Cost Of Living Index: 115
Median Income: $131,047
Average Home Price: $399,302
Home Price To Income Ratio: 3.0x
More on Union: Data | Cost Of Living | Real Estate
The overall cost of living in Union is 115. The median income in Union comes in at $131,047 and the average home value is $399,302 for 2024.

/10
Population: 5,466
Cost Of Living Index: 109
Median Income: $90,760
Average Home Price: $354,085
Home Price To Income Ratio: 3.9x
More on Douglass Hills: Data | Cost Of Living | Real Estate
The overall cost of living in Douglass Hills is 109. The median income in Douglass Hills comes in at $90,760 and the average home value is $354,085 for 2024.
/10
Population: 6,175
Cost Of Living Index: 107
Median Income: $110,147
Average Home Price: $424,893
Home Price To Income Ratio: 3.9x
More on Crestwood: Data | Cost Of Living | Real Estate
The overall cost of living in Crestwood is 107. The median income in Crestwood comes in at $110,147 and the average home value is $424,893 for 2024.

/10
Population: 7,331
Cost Of Living Index: 106
Median Income: $109,196
Average Home Price: $341,685
Home Price To Income Ratio: 3.1x
More on Villa Hills: Data | Crime | Cost Of Living | Real Estate
The overall cost of living in Villa Hills is 106. The median income in Villa Hills comes in at $109,196 and the average home value is $341,685 for 2024.

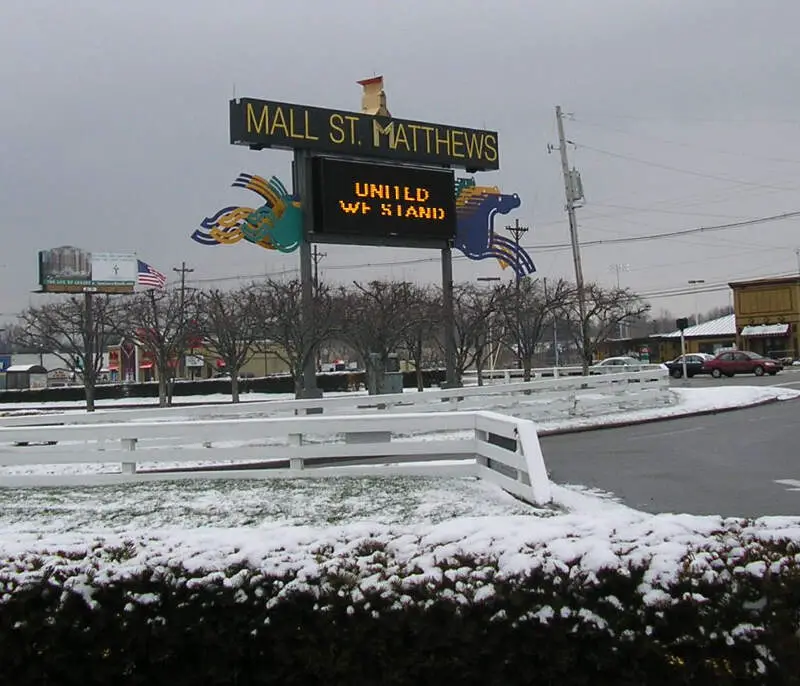
/10
Population: 17,511
Cost Of Living Index: 105
Median Income: $78,928
Average Home Price: $342,929
Home Price To Income Ratio: 4.3x
More on St. Matthews: Data | Crime | Cost Of Living | Real Estate
The overall cost of living in St. Matthews is 105. The median income in St. Matthews comes in at $78,928 and the average home value is $342,929 for 2024.

/10
Population: 8,447
Cost Of Living Index: 105
Median Income: $117,308
Average Home Price: $335,091
Home Price To Income Ratio: 2.9x
More on Edgewood: Data | Crime | Cost Of Living | Real Estate
The overall cost of living in Edgewood is 105. The median income in Edgewood comes in at $117,308 and the average home value is $335,091 for 2024.

/10
Population: 6,258
Cost Of Living Index: 104
Median Income: $76,151
Average Home Price: $256,036
Home Price To Income Ratio: 3.4x
More on Cold Spring: Data | Crime | Cost Of Living | Real Estate
The overall cost of living in Cold Spring is 104. The median income in Cold Spring comes in at $76,151 and the average home value is $256,036 for 2024.

/10
Population: 9,594
Cost Of Living Index: 103
Median Income: $81,881
Average Home Price: $319,167
Home Price To Income Ratio: 3.9x
More on Middletown: Data | Crime | Cost Of Living | Real Estate
The overall cost of living in Middletown is 103. The median income in Middletown comes in at $81,881 and the average home value is $319,167 for 2024.

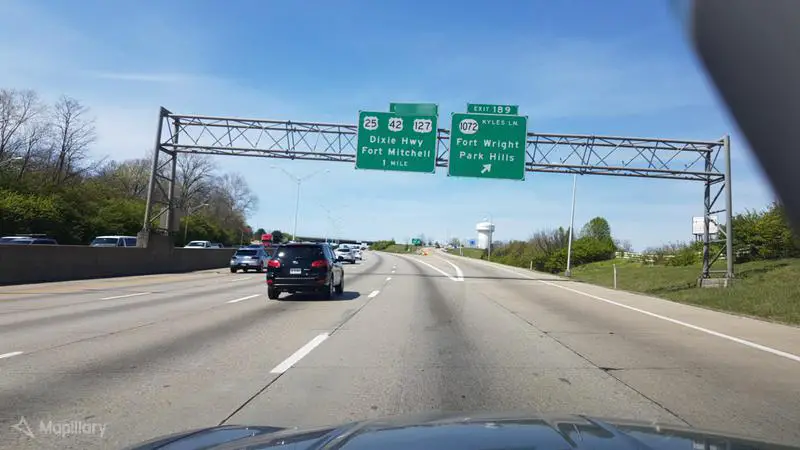
/10
Population: 8,667
Cost Of Living Index: 103
Median Income: $74,830
Average Home Price: $369,881
Home Price To Income Ratio: 4.9x
More on Fort Mitchell: Data | Crime | Cost Of Living | Real Estate
The overall cost of living in Fort Mitchell is 103. The median income in Fort Mitchell comes in at $74,830 and the average home value is $369,881 for 2024.

/10
Population: 5,841
Cost Of Living Index: 103
Median Income: $105,075
Average Home Price: $306,662
Home Price To Income Ratio: 2.9x
More on Fort Wright: Data | Crime | Cost Of Living | Real Estate
The overall cost of living in Fort Wright is 103. The median income in Fort Wright comes in at $105,075 and the average home value is $306,662 for 2024.
Methodology: How We Determined The Most Expensive Places To Live In The Bluegrass State For 2024
The two most important things to think about when it comes to being able to afford a city in Kentucky are:
- How much money do I make?
- How much do I have to spend to live there?
You need to understand your costs in the context of how much money you make.
For example, if the median household earns $100,000 and spends $40,000 on housing, it’s actually cheaper to live there than a place with a median income of $50,000 and housing costs of $21,000. You might spend more on housing, but you have more money overall to play with.
With that example in mind, we derived several statistics from the latest Census American Community Survey 2018-2022 around incomes and costs. They are:
- Overall Cost Of Living Index
- Median Home Price / Median Income (lower is better)
- Median Income / Median Rent (Higher is better)
- Median Home Price
You can then compare these metrics in each of the places in Kentucky to figure out which is the most expensive.
You are left with a “Cost of Living Index” by taking the average rank of each of these metrics for each city.
So we used that cost of living index to rank all of the 78 places in Kentucky that have more than 5,000 people.
The place with the highest cost of living in Kentucky according to the data is Union. We updated this article for 2024. This article is our tenth time ranking the most expensive places to live in Kentucky.
Summary: Taking A Chunk Out Of Your Paycheck In Kentucky For 2024
Well, there you have it, the places in Kentucky that have the highest cost of living, with Union ranking as the most expensive city in the Bluegrass State.
The most expensive cities in Kentucky are Union, Douglass Hills, Crestwood, Villa Hills, St. Matthews, Edgewood, Cold Spring, Middletown, Fort Mitchell, and Fort Wright.
Here’s a look at the most affordable cities in Kentucky according to the data:
- Williamsburg
- Russellville
- Monticello
For more Kentucky reading, check out:
- Best Places To Live In Kentucky
- Cheapest Places To Live In Kentucky
- Most Dangerous Cities In Kentucky
- Best Places To Raise A Family In Kentucky
- Safest Places In Kentucky
- Worst Places To Live In Kentucky
Most Expensive Cities In Kentucky
| Rank | City | Cost Of Living | Population | Median Income | Average Home Price | Home/Income Ratio |
|---|---|---|---|---|---|---|
| 1 | Union | 115 | 7,369 | $131,047 | $399,302 | 3.0x |
| 2 | Douglass Hills | 109 | 5,466 | $90,760 | $354,085 | 3.9x |
| 3 | Crestwood | 107 | 6,175 | $110,147 | $424,893 | 3.9x |
| 4 | Villa Hills | 106 | 7,331 | $109,196 | $341,685 | 3.1x |
| 5 | St. Matthews | 105 | 17,511 | $78,928 | $342,929 | 4.3x |
| 6 | Edgewood | 105 | 8,447 | $117,308 | $335,091 | 2.9x |
| 7 | Cold Spring | 104 | 6,258 | $76,151 | $256,036 | 3.4x |
| 8 | Middletown | 103 | 9,594 | $81,881 | $319,167 | 3.9x |
| 9 | Fort Mitchell | 103 | 8,667 | $74,830 | $369,881 | 4.9x |
| 10 | Fort Wright | 103 | 5,841 | $105,075 | $306,662 | 2.9x |
| 11 | Jeffersontown | 101 | 28,796 | $78,929 | $251,563 | 3.2x |
| 12 | Fort Thomas | 101 | 17,310 | $95,391 | $316,890 | 3.3x |
| 13 | Independence | 100 | 28,722 | $92,355 | $283,892 | 3.1x |
| 14 | Lyndon | 100 | 10,997 | $63,806 | $281,572 | 4.4x |
| 15 | Alexandria | 99 | 10,322 | $100,938 | $279,406 | 2.8x |
| 16 | Georgetown | 98 | 37,510 | $74,530 | $291,754 | 3.9x |
| 17 | Shelbyville | 98 | 17,239 | $74,433 | $271,621 | 3.6x |
| 18 | Elizabethtown | 97 | 31,425 | $54,493 | $230,510 | 4.2x |
| 19 | Taylor Mill | 97 | 6,851 | $79,781 | $245,188 | 3.1x |
| 20 | Wilmore | 97 | 6,017 | $59,848 | $271,874 | 4.5x |
| 21 | Walton | 97 | 5,492 | $79,811 | $303,985 | 3.8x |
| 22 | La Grange | 96 | 10,073 | $72,265 | $357,217 | 4.9x |
| 23 | Florence | 95 | 32,056 | $67,352 | $257,002 | 3.8x |
| 24 | Mount Washington | 95 | 17,987 | $91,185 | $286,136 | 3.1x |
| 25 | Shepherdsville | 95 | 14,136 | $71,875 | $228,290 | 3.2x |
| 26 | Pikeville | 95 | 7,563 | $41,324 | $82,759 | 2.0x |
| 27 | Louisville | 94 | 629,176 | $63,114 | $231,566 | 3.7x |
| 28 | Richmond | 94 | 34,883 | $45,457 | $259,818 | 5.7x |
| 29 | Erlanger | 94 | 19,577 | $74,147 | $217,776 | 2.9x |
| 30 | Danville | 94 | 17,191 | $48,038 | $219,456 | 4.6x |
| 31 | Vine Grove | 94 | 6,611 | $74,035 | $237,941 | 3.2x |
| 32 | Highland Heights | 94 | 6,566 | $44,910 | $186,185 | 4.1x |
| 33 | Bellevue | 94 | 5,596 | $66,741 | $215,115 | 3.2x |
| 34 | Newport | 93 | 14,190 | $50,278 | $198,174 | 3.9x |
| 35 | Morehead | 93 | 7,001 | $32,020 | $150,504 | 4.7x |
| 36 | Nicholasville | 92 | 31,352 | $61,832 | $277,506 | 4.5x |
| 37 | Radcliff | 92 | 22,981 | $54,558 | $191,577 | 3.5x |
| 38 | Versailles | 92 | 10,297 | $55,606 | $307,956 | 5.5x |
| 39 | Elsmere | 92 | 9,126 | $61,890 | $198,526 | 3.2x |
| 40 | Hillview | 92 | 8,681 | $63,578 | $196,339 | 3.1x |
| 41 | Frankfort | 91 | 28,460 | $53,905 | $209,529 | 3.9x |
| 42 | Paducah | 91 | 26,869 | $46,984 | $163,883 | 3.5x |
| 43 | Winchester | 91 | 19,080 | $50,982 | $224,257 | 4.4x |
| 44 | Berea | 91 | 15,404 | $54,481 | $216,269 | 4.0x |
| 45 | Bardstown | 91 | 13,564 | $47,654 | $232,877 | 4.9x |
| 46 | Paris | 91 | 10,143 | $46,752 | $217,396 | 4.7x |
| 47 | London | 91 | 7,612 | $45,858 | $166,838 | 3.6x |
| 48 | Dayton | 91 | 5,674 | $61,432 | $173,888 | 2.8x |
| 49 | Owensboro | 90 | 60,019 | $51,982 | $186,902 | 3.6x |
| 50 | Lawrenceburg | 90 | 11,749 | $58,935 | $223,391 | 3.8x |
| 51 | Mount Sterling | 90 | 7,532 | $47,408 | $184,088 | 3.9x |
| 52 | Covington | 89 | 40,923 | $53,770 | $181,857 | 3.4x |
| 53 | Madisonville | 89 | 19,433 | $54,234 | $143,015 | 2.6x |
| 54 | Lebanon | 89 | 6,274 | $37,500 | $185,248 | 4.9x |
| 55 | Bowling Green | 88 | 72,385 | $47,118 | $265,897 | 5.6x |
| 56 | Murray | 88 | 17,414 | $37,421 | $163,997 | 4.4x |
| 57 | Campbellsville | 88 | 11,434 | $53,254 | $178,765 | 3.4x |
| 58 | Harrodsburg | 88 | 9,057 | $49,293 | $196,771 | 4.0x |
| 59 | Maysville | 88 | 8,831 | $41,171 | $131,500 | 3.2x |
| 60 | Flatwoods | 88 | 7,312 | $58,294 | $123,058 | 2.1x |
| 61 | Cynthiana | 88 | 6,355 | $46,601 | $180,289 | 3.9x |
| 62 | Hazard | 88 | 5,194 | $65,846 | $92,026 | 1.4x |
| 63 | Henderson | 87 | 28,166 | $46,276 | $176,516 | 3.8x |
| 64 | Shively | 87 | 15,595 | $45,953 | $148,818 | 3.2x |
| 65 | Somerset | 87 | 11,998 | $33,245 | $181,592 | 5.5x |
| 66 | Hopkinsville | 86 | 31,042 | $43,577 | $170,550 | 3.9x |
| 67 | Mayfield | 86 | 10,011 | $42,589 | $130,153 | 3.1x |
| 68 | Oak Grove | 86 | 7,895 | $40,740 | $187,947 | 4.6x |
| 69 | Leitchfield | 86 | 6,432 | $43,214 | $171,337 | 4.0x |
| 70 | Princeton | 86 | 6,248 | $46,317 | $115,834 | 2.5x |
| 71 | Glasgow | 85 | 15,043 | $44,125 | $183,709 | 4.2x |
| 72 | Franklin | 84 | 10,141 | $54,784 | $223,713 | 4.1x |
| 73 | Central City | 84 | 5,740 | $52,184 | $109,487 | 2.1x |
| 74 | Middlesborough | 82 | 9,383 | $35,798 | $97,055 | 2.7x |
| 75 | Corbin | 81 | 8,611 | $52,929 | $155,672 | 2.9x |
| 76 | Monticello | 81 | 5,770 | $43,353 | $136,290 | 3.1x |
| 77 | Russellville | 80 | 7,186 | $45,484 | $181,096 | 4.0x |
| 78 | Williamsburg | 76 | 5,229 | $33,875 | $88,110 | 2.6x |