
Before you decide to relocate to Oklahoma, it’s important to research the exact cost of living around the state. And that’s what we’re going to help you do.
These are the places in Oklahoma that cost a pretty penny — the most expensive cities in the state.
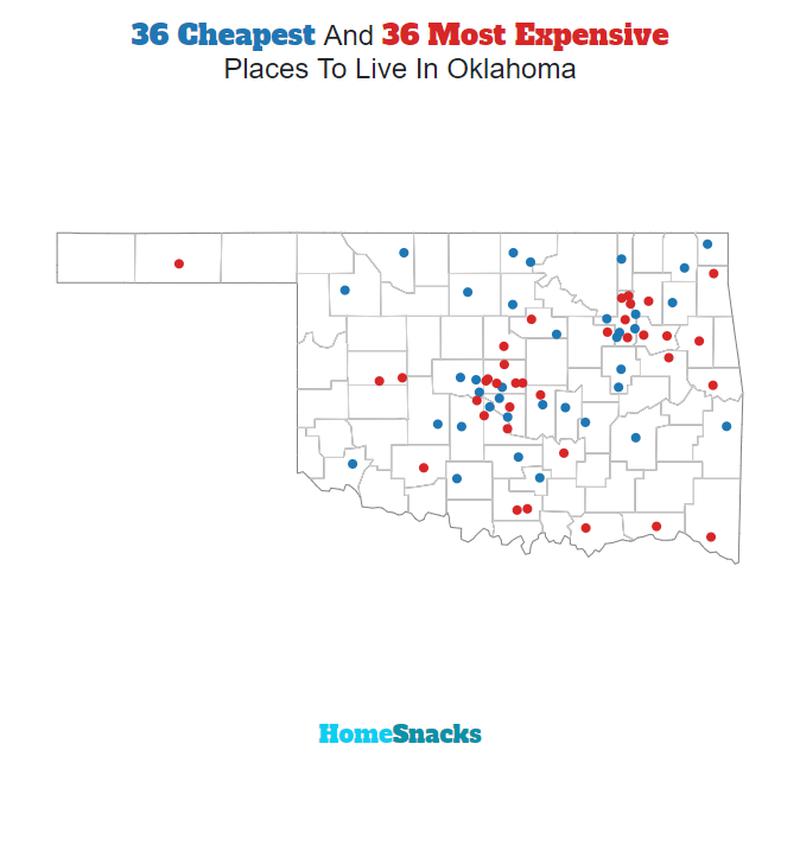
We used Saturday Night Science to compare the 2018-2022 American Community Survey on cost of living for the 73 places in Oklahoma with more than 5,000 people.
After we saved up for months and could finally afford it, we landed on this list of the ten most expensive cities in Oklahoma for 2024.
Table Of Contents: Top Ten | Methodology | Summary | Table
The 10 Most Expensive Places To Live In Oklahoma For 2024
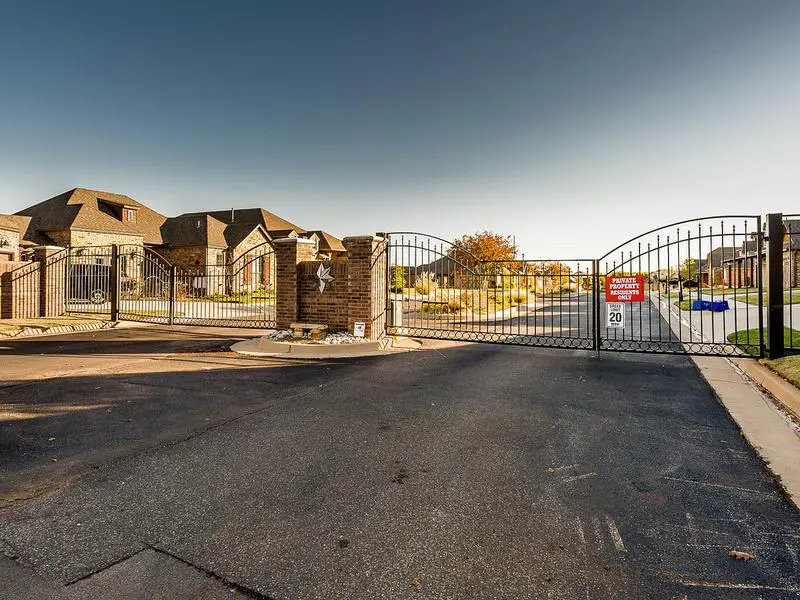
What’s the most expensive place to live in Oklahoma? Well, HomeSnacks crunched the numbers and discovered that Edmond is the most expensive place to live in Oklahoma.
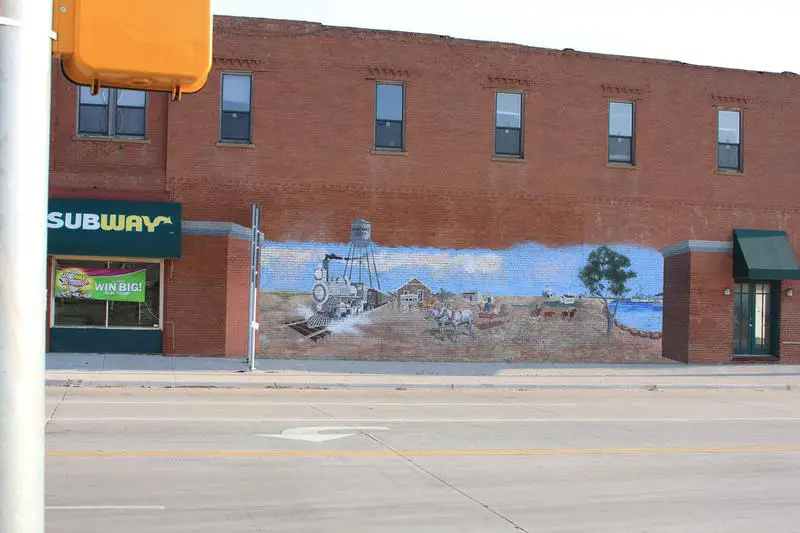
Henryetta (the cheapest place to live in Oklahoma) can show these guys how to live on a budget in the coming years. Read on for how these places had costs rise faster than inflation.
And if you already knew these places were expensive, check out some more reading about Oklahoma and the most expensive cities in the country:
The 10 Most Expensive Places To Live In Oklahoma For 2024

/10
Population: 94,503
Cost Of Living Index: 100
Median Income: $96,389
Average Home Price: $334,356
Home Price To Income Ratio: 3.5x
More on Edmond: Data | Crime | Cost Of Living | Real Estate
The overall cost of living in Edmond is 100. The median income in Edmond comes in at $96,389 and the average home value is $334,356 for 2024.


/10
Population: 25,872
Cost Of Living Index: 98
Median Income: $101,767
Average Home Price: $325,075
Home Price To Income Ratio: 3.2x
More on Jenks: Data | Crime | Cost Of Living | Real Estate
The overall cost of living in Jenks is 98. The median income in Jenks comes in at $101,767 and the average home value is $325,075 for 2024.

/10
Population: 11,508
Cost Of Living Index: 98
Median Income: $90,469
Average Home Price: $283,796
Home Price To Income Ratio: 3.1x
More on Newcastle: Data | Crime | Cost Of Living | Real Estate
The overall cost of living in Newcastle is 98. The median income in Newcastle comes in at $90,469 and the average home value is $283,796 for 2024.

/10
Population: 7,629
Cost Of Living Index: 97
Median Income: $86,453
Average Home Price: $317,037
Home Price To Income Ratio: 3.7x
More on Piedmont: Data | Crime | Cost Of Living | Real Estate
The overall cost of living in Piedmont is 97. The median income in Piedmont comes in at $86,453 and the average home value is $317,037 for 2024.

/10
Population: 127,701
Cost Of Living Index: 96
Median Income: $62,849
Average Home Price: $241,585
Home Price To Income Ratio: 3.8x
More on Norman: Data | Crime | Cost Of Living | Real Estate
The overall cost of living in Norman is 96. The median income in Norman comes in at $62,849 and the average home value is $241,585 for 2024.

/10
Population: 8,708
Cost Of Living Index: 96
Median Income: $86,964
Average Home Price: $285,528
Home Price To Income Ratio: 3.3x
More on Blanchard: Data | Crime | Cost Of Living | Real Estate
The overall cost of living in Blanchard is 96. The median income in Blanchard comes in at $86,964 and the average home value is $285,528 for 2024.

/10
Population: 28,731
Cost Of Living Index: 94
Median Income: $93,765
Average Home Price: $306,678
Home Price To Income Ratio: 3.3x
More on Bixby: Data | Crime | Cost Of Living | Real Estate
The overall cost of living in Bixby is 94. The median income in Bixby comes in at $93,765 and the average home value is $306,678 for 2024.
![]()
/10
Population: 114,237
Cost Of Living Index: 93
Median Income: $82,547
Average Home Price: $265,688
Home Price To Income Ratio: 3.2x
More on Broken Arrow: Data | Crime | Cost Of Living | Real Estate
The overall cost of living in Broken Arrow is 93. The median income in Broken Arrow comes in at $82,547 and the average home value is $265,688 for 2024.

/10
Population: 38,134
Cost Of Living Index: 92
Median Income: $79,183
Average Home Price: $294,323
Home Price To Income Ratio: 3.7x
More on Owasso: Data | Crime | Cost Of Living | Real Estate
The overall cost of living in Owasso is 92. The median income in Owasso comes in at $79,183 and the average home value is $294,323 for 2024.


/10
Population: 11,999
Cost Of Living Index: 92
Median Income: $47,851
Average Home Price: $203,753
Home Price To Income Ratio: 4.3x
More on Weatherford: Data | Crime | Cost Of Living | Real Estate
The overall cost of living in Weatherford is 92. The median income in Weatherford comes in at $47,851 and the average home value is $203,753 for 2024.
Methodology: How We Determined The Most Expensive Places To Live In The Sooner State For 2024
The two most important things to think about when it comes to being able to afford a city in Oklahoma are:
- How much money do I make?
- How much do I have to spend to live there?
You need to understand your costs in the context of how much money you make.
For example, if the median household earns $100,000 and spends $40,000 on housing, it’s actually cheaper to live there than a place with a median income of $50,000 and housing costs of $21,000. You might spend more on housing, but you have more money overall to play with.
With that example in mind, we derived several statistics from the latest Census American Community Survey 2018-2022 around incomes and costs. They are:
- Overall Cost Of Living Index
- Median Home Price / Median Income (lower is better)
- Median Income / Median Rent (Higher is better)
- Median Home Price
You can then compare these metrics in each of the places in Oklahoma to figure out which is the most expensive.
You are left with a “Cost of Living Index” by taking the average rank of each of these metrics for each city.
So we used that cost of living index to rank all of the 73 places in Oklahoma that have more than 5,000 people.
The place with the highest cost of living in Oklahoma according to the data is Edmond. We updated this article for 2024. This article is our tenth time ranking the most expensive places to live in Oklahoma.
Summary: Taking A Chunk Out Of Your Paycheck In Oklahoma For 2024
Well, there you have it, the places in Oklahoma that have the highest cost of living, with Edmond ranking as the most expensive city in the Sooner State.
The most expensive cities in Oklahoma are Edmond, Jenks, Newcastle, Piedmont, Norman, Blanchard, Bixby, Broken Arrow, Owasso, and Weatherford.
Here’s a look at the most affordable cities in Oklahoma according to the data:
- Henryetta
- Muskogee
- Anadarko
For more Oklahoma reading, check out:
- Best Places To Live In Oklahoma
- Cheapest Places To Live In Oklahoma
- Most Dangerous Cities In Oklahoma
- Best Places To Raise A Family In Oklahoma
- Safest Places In Oklahoma
- Worst Places To Live In Oklahoma
Most Expensive Cities In Oklahoma
| Rank | City | Cost Of Living | Population | Median Income | Average Home Price | Home/Income Ratio |
|---|---|---|---|---|---|---|
| 1 | Edmond | 100 | 94,503 | $96,389 | $334,356 | 3.5x |
| 2 | Jenks | 98 | 25,872 | $101,767 | $325,075 | 3.2x |
| 3 | Newcastle | 98 | 11,508 | $90,469 | $283,796 | 3.1x |
| 4 | Piedmont | 97 | 7,629 | $86,453 | $317,037 | 3.7x |
| 5 | Norman | 96 | 127,701 | $62,849 | $241,585 | 3.8x |
| 6 | Blanchard | 96 | 8,708 | $86,964 | $285,528 | 3.3x |
| 7 | Bixby | 94 | 28,731 | $93,765 | $306,678 | 3.3x |
| 8 | Broken Arrow | 93 | 114,237 | $82,547 | $265,688 | 3.2x |
| 9 | Owasso | 92 | 38,134 | $79,183 | $294,323 | 3.7x |
| 10 | Weatherford | 92 | 11,999 | $47,851 | $203,753 | 4.3x |
| 11 | Moore | 91 | 62,685 | $73,285 | $207,451 | 2.8x |
| 12 | Elk City | 91 | 11,494 | $47,903 | $150,381 | 3.1x |
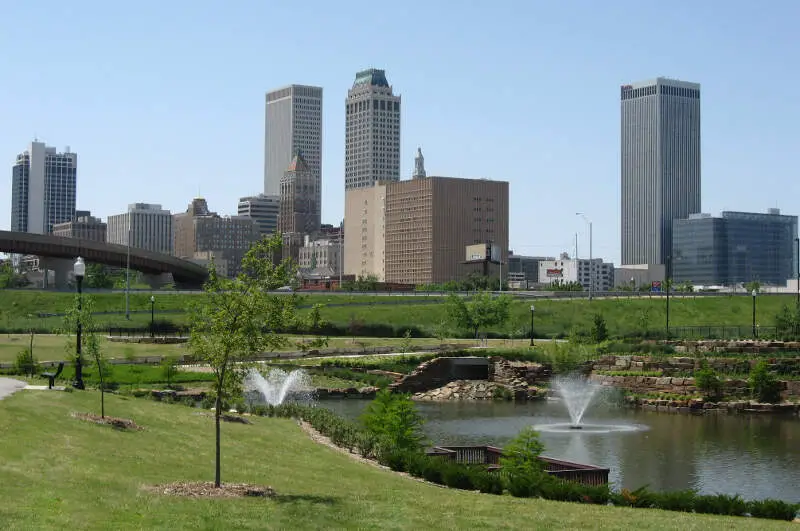
| 13 | Tulsa | 90 | 411,938 | $56,648 | $192,607 | 3.4x |
| 14 | Purcell | 90 | 6,632 | $68,295 | $214,329 | 3.1x |
| 15 | Verdigris | 90 | 5,308 | $83,281 | $232,151 | 2.8x |
| 16 | Mustang | 89 | 20,518 | $84,162 | $264,097 | 3.1x |
| 17 | Glenpool | 89 | 13,683 | $75,876 | $222,664 | 2.9x |
| 18 | Tuttle | 89 | 7,533 | $98,393 | $299,487 | 3.0x |
| 19 | Oklahoma City | 88 | 681,088 | $64,251 | $195,449 | 3.0x |
| 20 | Stillwater | 88 | 48,644 | $39,998 | $233,737 | 5.8x |
| 21 | Sapulpa | 88 | 22,030 | $62,168 | $183,005 | 2.9x |
| 22 | Collinsville | 88 | 8,073 | $76,866 | $261,886 | 3.4x |
| 23 | Grove | 88 | 7,012 | $56,469 | $265,341 | 4.7x |
| 24 | Lawton | 87 | 91,023 | $51,561 | $121,696 | 2.4x |
| 25 | Bartlesville | 87 | 37,314 | $58,230 | $166,447 | 2.9x |
| 26 | Choctaw | 87 | 12,154 | $90,241 | $281,479 | 3.1x |
| 27 | The Village | 87 | 9,479 | $67,524 | $200,198 | 3.0x |
| 28 | Noble | 87 | 7,168 | $84,029 | $184,737 | 2.2x |
| 29 | Shawnee | 86 | 31,391 | $50,695 | $141,120 | 2.8x |
| 30 | Sand Springs | 86 | 19,925 | $70,431 | $212,949 | 3.0x |
| 31 | Woodward | 86 | 12,067 | $54,864 | $123,155 | 2.2x |
| 32 | Coweta | 86 | 9,903 | $57,166 | $246,248 | 4.3x |
| 33 | Duncan | 85 | 22,759 | $55,162 | $113,467 | 2.1x |
| 34 | Clinton | 85 | 8,499 | $62,368 | $97,279 | 1.6x |
| 35 | Catoosa | 85 | 7,680 | $67,143 | $195,064 | 2.9x |
| 36 | Idabel | 85 | 6,994 | $34,683 | $118,740 | 3.4x |
| 37 | Tecumseh | 85 | 6,326 | $53,729 | $119,271 | 2.2x |
| 38 | Harrah | 85 | 6,259 | $68,661 | $224,969 | 3.3x |
| 39 | Yukon | 84 | 24,198 | $75,865 | $255,618 | 3.4x |
| 40 | Bethany | 84 | 20,620 | $54,606 | $169,487 | 3.1x |
| 41 | Claremore | 84 | 19,724 | $56,257 | $245,916 | 4.4x |
| 42 | Altus | 84 | 18,711 | $56,620 | $86,441 | 1.5x |
| 43 | Chickasha | 84 | 16,231 | $55,136 | $126,753 | 2.3x |
| 44 | Guthrie | 84 | 10,872 | $55,405 | $218,592 | 3.9x |
| 45 | Pryor Creek | 83 | 9,480 | $46,635 | $156,510 | 3.4x |
| 46 | Pauls Valley | 83 | 6,031 | $45,400 | $126,578 | 2.8x |
| 47 | Midwest City | 82 | 58,124 | $56,811 | $158,404 | 2.8x |
| 48 | Enid | 82 | 50,961 | $60,790 | $116,791 | 1.9x |
| 49 | Ardmore | 82 | 24,784 | $49,408 | $139,851 | 2.8x |
| 50 | Durant | 82 | 18,759 | $44,593 | $220,092 | 4.9x |
| 51 | El Reno | 82 | 17,474 | $49,988 | $158,475 | 3.2x |
| 52 | Ponca City | 81 | 24,441 | $51,367 | $119,659 | 2.3x |
| 53 | McAlester | 81 | 18,110 | $46,875 | $142,233 | 3.0x |
| 54 | Ada | 81 | 16,537 | $47,264 | $165,138 | 3.5x |
| 55 | Tahlequah | 81 | 16,389 | $49,444 | $179,457 | 3.6x |
| 56 | Warr Acres | 81 | 10,424 | $54,221 | $170,961 | 3.2x |
| 57 | Cushing | 81 | 8,336 | $46,602 | $112,267 | 2.4x |
| 58 | Alva | 81 | 5,020 | $41,809 | $93,771 | 2.2x |
| 59 | Del City | 80 | 21,682 | $48,200 | $129,919 | 2.7x |
| 60 | Guymon | 80 | 12,743 | $55,526 | $149,979 | 2.7x |
| 61 | Seminole | 80 | 7,144 | $34,599 | $109,289 | 3.2x |
| 62 | Miami | 79 | 12,995 | $44,010 | $105,612 | 2.4x |
| 63 | Poteau | 79 | 8,852 | $47,782 | $163,978 | 3.4x |
| 64 | Wagoner | 79 | 7,813 | $55,169 | $161,103 | 2.9x |
| 65 | Blackwell | 79 | 6,132 | $47,333 | $56,852 | 1.2x |
| 66 | Okmulgee | 78 | 11,366 | $38,311 | $92,537 | 2.4x |
| 67 | Vinita | 78 | 5,207 | $38,621 | $148,143 | 3.8x |
| 68 | Hugo | 78 | 5,178 | $30,089 | $101,969 | 3.4x |
| 69 | Sallisaw | 77 | 8,524 | $44,310 | $163,587 | 3.7x |
| 70 | Holdenville | 77 | 5,900 | $38,232 | $51,182 | 1.3x |
| 71 | Anadarko | 77 | 5,723 | $49,770 | $57,486 | 1.2x |
| 72 | Muskogee | 76 | 36,933 | $46,825 | $123,006 | 2.6x |
| 73 | Henryetta | 75 | 5,639 | $42,513 | $95,811 | 2.3x |