
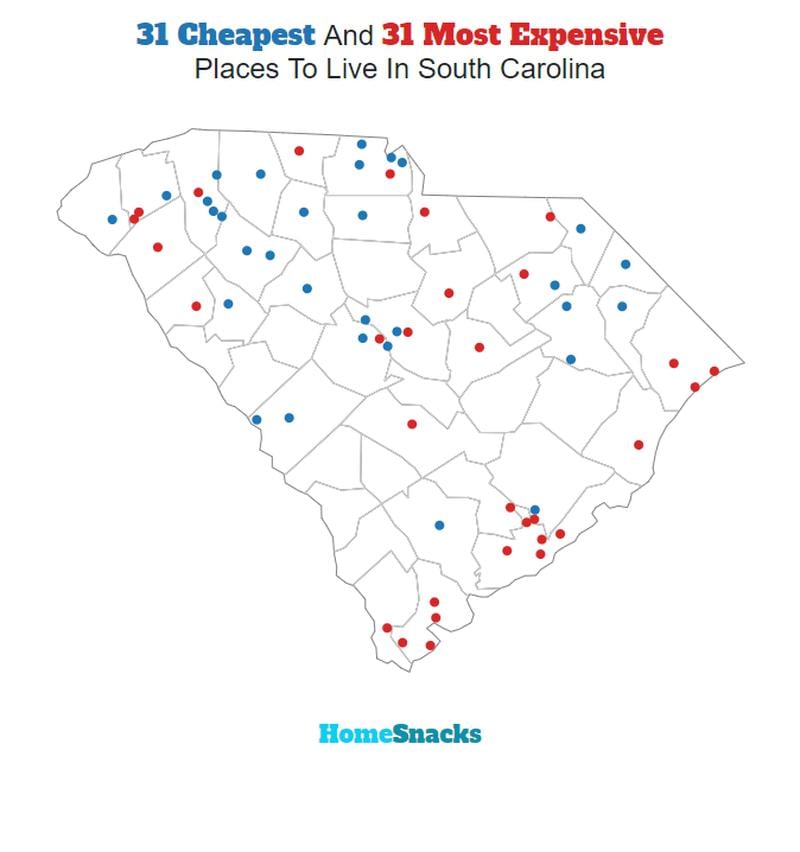
Before you decide to relocate to South Carolina, it’s important to research the exact cost of living around the state. And that’s what we’re going to help you do.
These are the places in South Carolina that cost a pretty penny — the most expensive cities in the state.
We used Saturday Night Science to compare the 2018-2022 American Community Survey on cost of living for the 65 places in South Carolina with more than 5,000 people.
After we saved up for months and could finally afford it, we landed on this list of the ten most expensive cities in South Carolina for 2024.
Table Of Contents: Top Ten | Methodology | Summary | Table
The 10 Most Expensive Places To Live In South Carolina For 2024
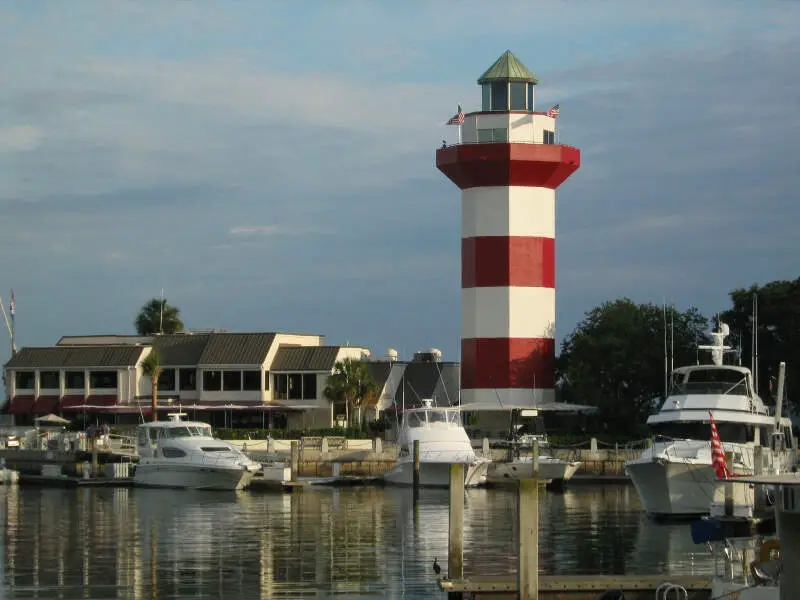
What’s the most expensive place to live in South Carolina? Well, HomeSnacks crunched the numbers and discovered that Hilton Head Island is the most expensive place to live in South Carolina.
Laurens (the cheapest place to live in South Carolina) can show these guys how to live on a budget in the coming years. Read on for how these places had costs rise faster than inflation.
And if you already knew these places were expensive, check out some more reading about South Carolina and the most expensive cities in the country:
The 10 Most Expensive Places To Live In South Carolina For 2024

/10
Population: 37,708
Cost Of Living Index: 134
Median Income: $93,694
Average Home Price: $746,761
Home Price To Income Ratio: 8.0x
More on Hilton Head Island: Data | Cost Of Living | Real Estate
The overall cost of living in Hilton Head Island is 134. The median income in Hilton Head Island comes in at $93,694 and the average home value is $746,761 for 2024.

/10
Population: 90,945
Cost Of Living Index: 128
Median Income: $115,167
Average Home Price: $777,495
Home Price To Income Ratio: 6.8x
More on Mount Pleasant: Data | Crime | Cost Of Living | Real Estate
The overall cost of living in Mount Pleasant is 128. The median income in Mount Pleasant comes in at $115,167 and the average home value is $777,495 for 2024.

/10
Population: 12,816
Cost Of Living Index: 118
Median Income: $140,172
Average Home Price: $565,388
Home Price To Income Ratio: 4.0x
More on Tega Cay: Data | Crime | Cost Of Living | Real Estate
The overall cost of living in Tega Cay is 118. The median income in Tega Cay comes in at $140,172 and the average home value is $565,388 for 2024.
/10
Population: 8,048
Cost Of Living Index: 112
Median Income: $75,948
Average Home Price: $408,943
Home Price To Income Ratio: 5.4x
More on Hardeeville: Data | Crime | Cost Of Living | Real Estate
The overall cost of living in Hardeeville is 112. The median income in Hardeeville comes in at $75,948 and the average home value is $408,943 for 2024.

/10
Population: 149,960
Cost Of Living Index: 111
Median Income: $83,891
Average Home Price: $530,719
Home Price To Income Ratio: 6.3x
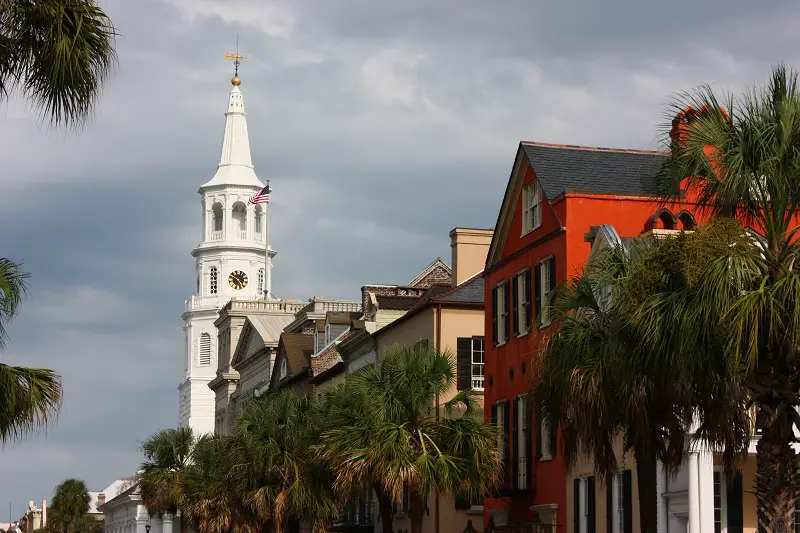
More on Charleston: Data | Crime | Cost Of Living | Real Estate
The overall cost of living in Charleston is 111. The median income in Charleston comes in at $83,891 and the average home value is $530,719 for 2024.

/10
Population: 29,375
Cost Of Living Index: 111
Median Income: $99,575
Average Home Price: $494,049
Home Price To Income Ratio: 5.0x
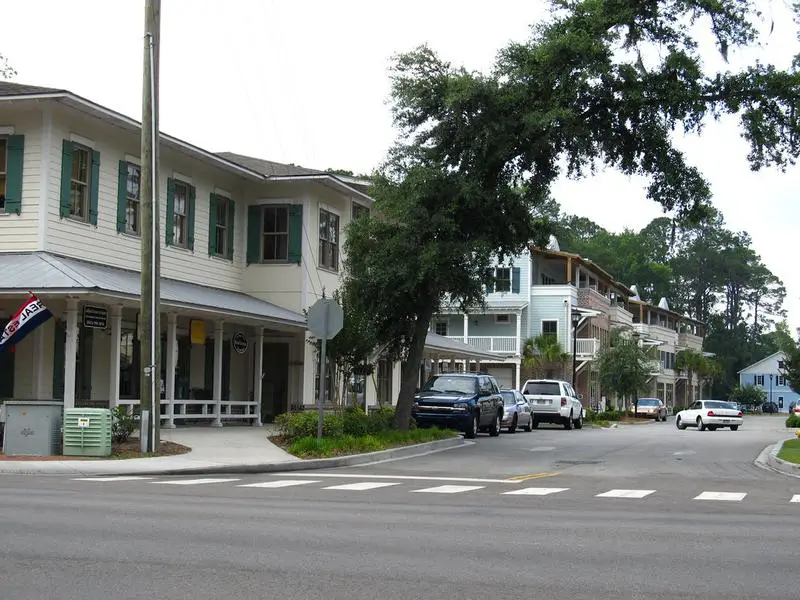
More on Bluffton: Data | Crime | Cost Of Living | Real Estate
The overall cost of living in Bluffton is 111. The median income in Bluffton comes in at $99,575 and the average home value is $494,049 for 2024.

/10
Population: 11,689
Cost Of Living Index: 106
Median Income: $95,364
Average Home Price: $552,752
Home Price To Income Ratio: 5.8x
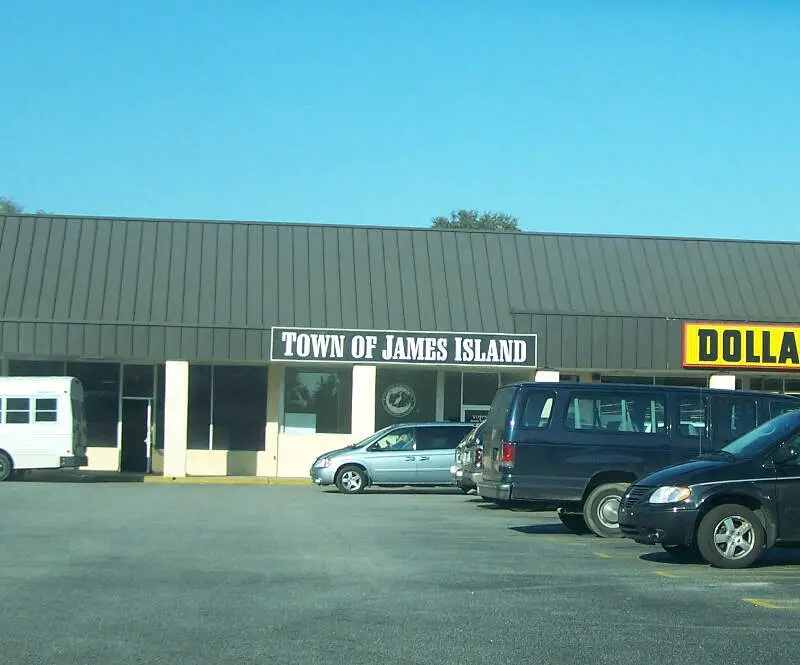
More on James Island: Data | Cost Of Living | Real Estate
The overall cost of living in James Island is 106. The median income in James Island comes in at $95,364 and the average home value is $552,752 for 2024.

/10
Population: 18,850
Cost Of Living Index: 105
Median Income: $69,792
Average Home Price: $398,493
Home Price To Income Ratio: 5.7x
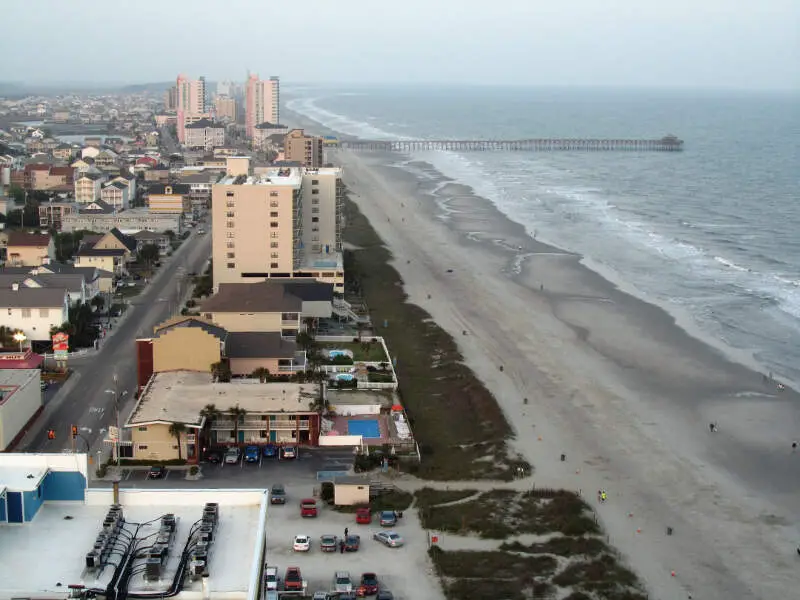
More on North Myrtle Beach: Data | Crime | Cost Of Living | Real Estate
The overall cost of living in North Myrtle Beach is 105. The median income in North Myrtle Beach comes in at $69,792 and the average home value is $398,493 for 2024.

/10
Population: 14,573
Cost Of Living Index: 104
Median Income: $68,909
Average Home Price: $326,136
Home Price To Income Ratio: 4.7x
More on Port Royal: Data | Crime | Cost Of Living | Real Estate
The overall cost of living in Port Royal is 104. The median income in Port Royal comes in at $68,909 and the average home value is $326,136 for 2024.

/10
Population: 26,022
Cost Of Living Index: 103
Median Income: $128,125
Average Home Price: $505,522
Home Price To Income Ratio: 3.9x
More on Fort Mill: Data | Crime | Cost Of Living | Real Estate
The overall cost of living in Fort Mill is 103. The median income in Fort Mill comes in at $128,125 and the average home value is $505,522 for 2024.
Methodology: How We Determined The Most Expensive Places To Live In The Palmetto State For 2024
The two most important things to think about when it comes to being able to afford a city in South Carolina are:
- How much money do I make?
- How much do I have to spend to live there?
You need to understand your costs in the context of how much money you make.
For example, if the median household earns $100,000 and spends $40,000 on housing, it’s actually cheaper to live there than a place with a median income of $50,000 and housing costs of $21,000. You might spend more on housing, but you have more money overall to play with.
With that example in mind, we derived several statistics from the latest Census American Community Survey 2018-2022 around incomes and costs. They are:
- Overall Cost Of Living Index
- Median Home Price / Median Income (lower is better)
- Median Income / Median Rent (Higher is better)
- Median Home Price
You can then compare these metrics in each of the places in South Carolina to figure out which is the most expensive.
You are left with a “Cost of Living Index” by taking the average rank of each of these metrics for each city.
So we used that cost of living index to rank all of the 65 places in South Carolina that have more than 5,000 people.
The place with the highest cost of living in South Carolina according to the data is Hilton Head Island. We updated this article for 2024. This article is our tenth time ranking the most expensive places to live in South Carolina.
Summary: Taking A Chunk Out Of Your Paycheck In South Carolina For 2024
Well, there you have it, the places in South Carolina that have the highest cost of living, with Hilton Head Island ranking as the most expensive city in the Palmetto State.
The most expensive cities in South Carolina are Hilton Head Island, Mount Pleasant, Tega Cay, Hardeeville, Charleston, Bluffton, James Island, North Myrtle Beach, Port Royal, and Fort Mill.
Here’s a look at the most affordable cities in South Carolina according to the data:
- Laurens
- Gaffney
- Union
For more South Carolina reading, check out:
- Best Places To Live In South Carolina
- Cheapest Places To Live In South Carolina
- Most Dangerous Cities In South Carolina
- Best Places To Raise A Family In South Carolina
- Safest Places In South Carolina
- Worst Places To Live In South Carolina
Most Expensive Cities In South Carolina
| Rank | City | Cost Of Living | Population | Median Income | Average Home Price | Home/Income Ratio |
|---|---|---|---|---|---|---|
| 1 | Hilton Head Island | 134 | 37,708 | $93,694 | $746,761 | 8.0x |
| 2 | Mount Pleasant | 128 | 90,945 | $115,167 | $777,495 | 6.8x |
| 3 | Tega Cay | 118 | 12,816 | $140,172 | $565,388 | 4.0x |
| 4 | Hardeeville | 112 | 8,048 | $75,948 | $408,943 | 5.4x |
| 5 | Charleston | 111 | 149,960 | $83,891 | $530,719 | 6.3x |
| 6 | Bluffton | 111 | 29,375 | $99,575 | $494,049 | 5.0x |
| 7 | James Island | 106 | 11,689 | $95,364 | $552,752 | 5.8x |
| 8 | North Myrtle Beach | 105 | 18,850 | $69,792 | $398,493 | 5.7x |
| 9 | Port Royal | 104 | 14,573 | $68,909 | $326,136 | 4.7x |
| 10 | Fort Mill | 103 | 26,022 | $128,125 | $505,522 | 3.9x |
| 11 | Greenville | 102 | 70,838 | $65,519 | $295,392 | 4.5x |
| 12 | Hanahan | 102 | 20,731 | $79,305 | $384,391 | 4.8x |
| 13 | Forest Acres | 102 | 10,514 | $68,110 | $291,080 | 4.3x |
| 14 | Hollywood | 102 | 5,397 | $77,191 | $467,948 | 6.1x |
| 15 | Lexington | 101 | 23,665 | $78,164 | $289,130 | 3.7x |
| 16 | Goose Creek | 100 | 45,858 | $84,041 | $309,585 | 3.7x |
| 17 | Beaufort | 100 | 13,582 | $60,366 | $368,692 | 6.1x |
| 18 | Summerville | 99 | 50,839 | $73,712 | $370,371 | 5.0x |
| 19 | Clemson | 99 | 17,557 | $50,263 | $363,229 | 7.2x |
| 20 | Myrtle Beach | 98 | 36,064 | $50,558 | $301,360 | 6.0x |
| 21 | Columbia | 97 | 136,754 | $54,095 | $222,099 | 4.1x |
| 22 | West Columbia | 97 | 17,459 | $52,648 | $211,731 | 4.0x |
| 23 | Irmo | 97 | 11,685 | $77,656 | $271,045 | 3.5x |
| 24 | Sumter | 96 | 43,046 | $48,900 | $179,925 | 3.7x |
| 25 | Simpsonville | 96 | 24,133 | $79,937 | $360,596 | 4.5x |
| 26 | Camden | 96 | 7,834 | $54,141 | $211,324 | 3.9x |
| 27 | Mauldin | 95 | 25,267 | $75,565 | $282,107 | 3.7x |
| 28 | Moncks Corner | 95 | 13,456 | $83,079 | $354,593 | 4.3x |
| 29 | Clover | 95 | 6,800 | $63,649 | $392,293 | 6.2x |
| 30 | North Charleston | 94 | 115,755 | $58,534 | $292,239 | 5.0x |
| 31 | Florence | 94 | 39,931 | $56,031 | $207,198 | 3.7x |
| 32 | Greer | 94 | 37,010 | $73,534 | $327,385 | 4.5x |
| 33 | Conway | 94 | 25,121 | $48,161 | $283,094 | 5.9x |
| 34 | Easley | 93 | 23,135 | $62,551 | $298,368 | 4.8x |
| 35 | York | 93 | 8,534 | $50,177 | $333,788 | 6.7x |
| 36 | Rock Hill | 92 | 74,170 | $60,807 | $312,290 | 5.1x |
| 37 | Cayce | 92 | 13,755 | $56,976 | $195,496 | 3.4x |
| 38 | Seneca | 92 | 8,834 | $48,108 | $275,023 | 5.7x |
| 39 | Orangeburg | 91 | 13,220 | $29,340 | $142,887 | 4.9x |
| 40 | Newberry | 90 | 10,682 | $47,565 | $163,742 | 3.4x |
| 41 | Fountain Inn | 90 | 10,675 | $73,665 | $280,678 | 3.8x |
| 42 | Travelers Rest | 90 | 7,929 | $44,375 | $299,948 | 6.8x |
| 43 | Marion | 90 | 6,402 | $28,551 | $90,130 | 3.2x |
| 44 | Walterboro | 90 | 5,515 | $46,119 | $181,873 | 3.9x |
| 45 | Batesburg-Leesville | 90 | 5,004 | $49,807 | $137,614 | 2.8x |
| 46 | Spartanburg | 89 | 38,301 | $49,140 | $209,990 | 4.3x |
| 47 | Aiken | 89 | 32,014 | $65,712 | $248,666 | 3.8x |
| 48 | Georgetown | 89 | 8,465 | $50,000 | $244,215 | 4.9x |
| 49 | Dillon | 89 | 6,454 | $34,086 | $82,630 | 2.4x |
| 50 | Anderson | 88 | 29,345 | $40,445 | $247,118 | 6.1x |
| 51 | Lancaster | 88 | 8,592 | $37,714 | $262,150 | 7.0x |
| 52 | Hartsville | 88 | 7,450 | $46,230 | $156,598 | 3.4x |
| 53 | Darlington | 88 | 6,172 | $33,750 | $123,699 | 3.7x |
| 54 | Lyman | 88 | 6,099 | $76,723 | $289,160 | 3.8x |
| 55 | Central | 88 | 5,272 | $45,909 | $247,449 | 5.4x |
| 56 | Lake City | 87 | 6,080 | $37,013 | $113,134 | 3.1x |
| 57 | North Augusta | 86 | 24,425 | $85,093 | $235,984 | 2.8x |
| 58 | Bennettsville | 86 | 6,975 | $37,891 | $84,777 | 2.2x |
| 59 | Chester | 86 | 5,260 | $39,951 | $142,891 | 3.6x |
| 60 | Cheraw | 86 | 5,056 | $30,658 | $146,907 | 4.8x |
| 61 | Clinton | 85 | 7,624 | $38,350 | $126,502 | 3.3x |
| 62 | Greenwood | 84 | 22,528 | $38,884 | $169,336 | 4.4x |
| 63 | Union | 84 | 8,099 | $32,548 | $108,743 | 3.3x |
| 64 | Gaffney | 83 | 12,651 | $38,059 | $160,274 | 4.2x |
| 65 | Laurens | 83 | 9,276 | $52,585 | $147,919 | 2.8x |