
Most Hispanic/Latino cities in New Jersey research summary. We used Saturday Night Science to analyze New Jersey’s most recent Census data to determine the most Hispanic/Latino cities based on the percentage of Hispanic/Latino residents. Here are the results of our analysis:
-
The most Hispanic/Latino city in New Jersey is Union City, based on the most recent Census data.
-
Union City is 81.34% Hispanic/Latino.
-
The least Hispanic/Latino city in New Jersey is Little Silver.
-
Little Silver is 0.87% Hispanic/Latino.
-
New Jersey is 21.2% Hispanic/Latino.
-
New Jersey is the 8th most Hispanic/Latino state in the United States.
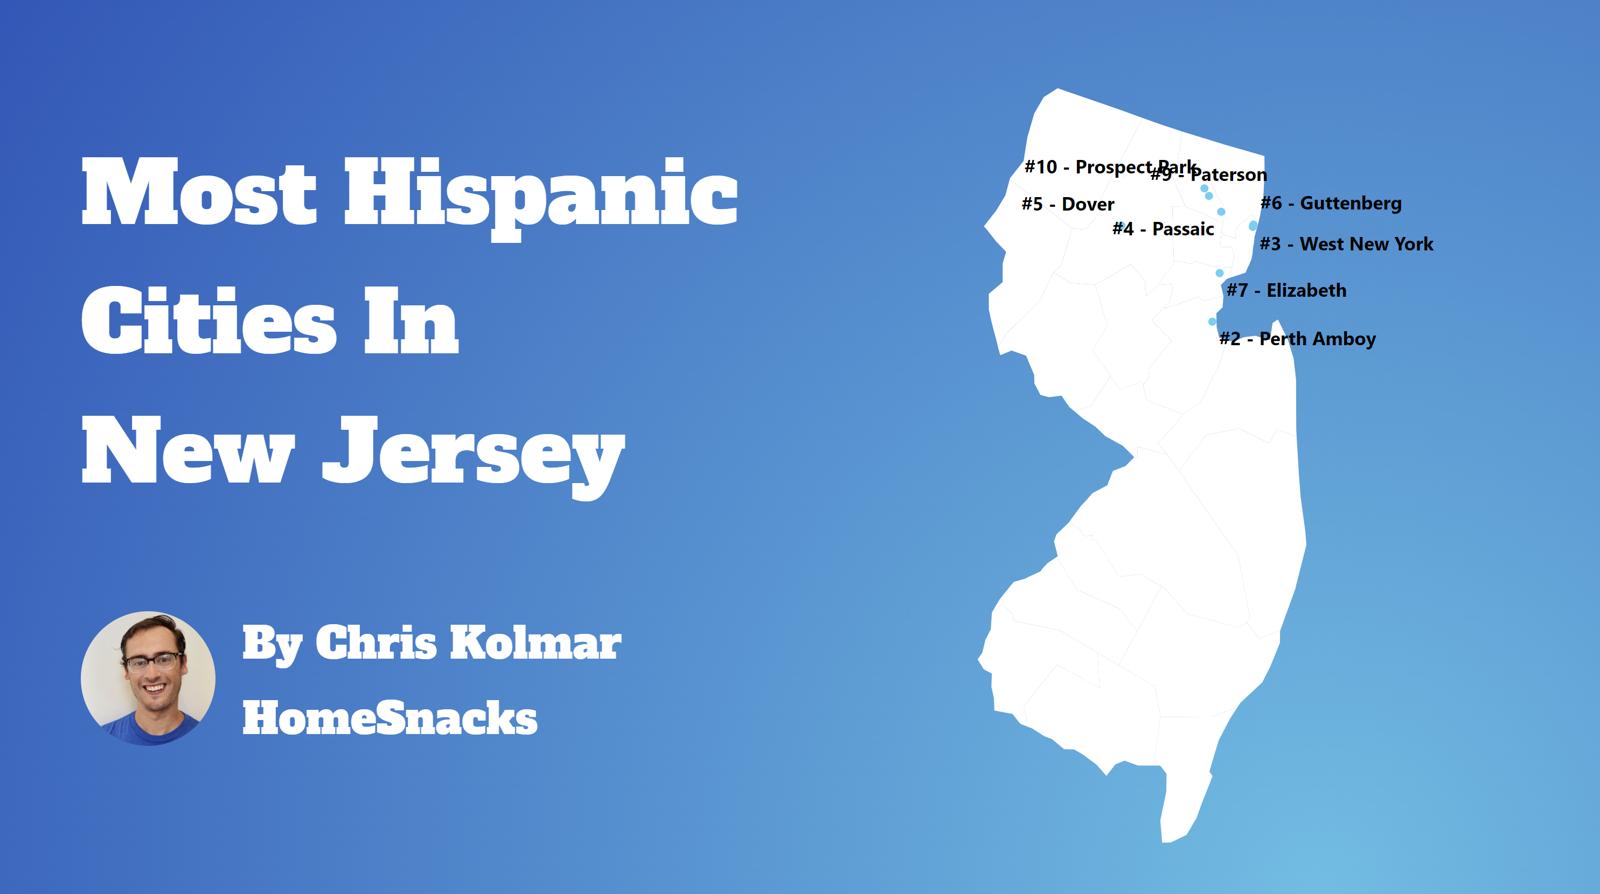
Table Of Contents: Top Ten | Methodology | Summary | Table
The 10 Cities In New Jersey With The Largest Hispanic Population For 2024
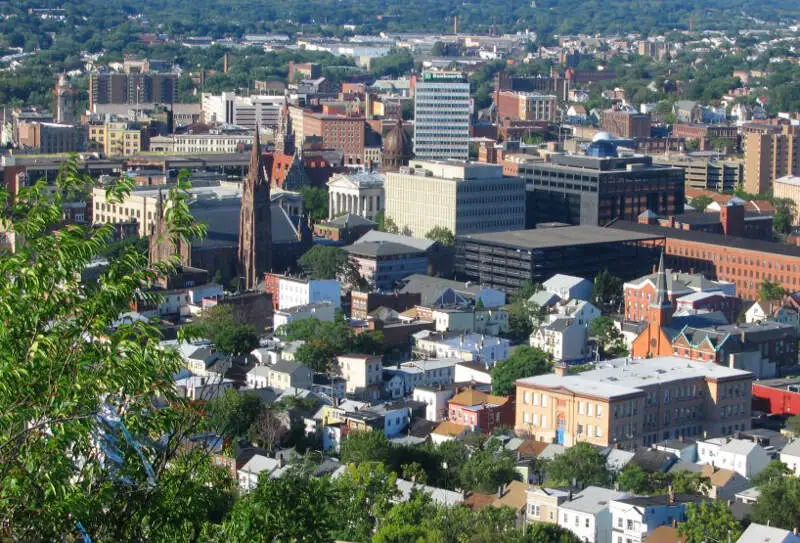
What’s the city in New Jersey with the largest Hispanic/Latino population? Union City took the number one overall spot for the largest Hispanic population in New Jersey for 2024.
Continue below to see how we crunched the numbers and how your town ranked.
To see where New Jersey ranked as a state on diversity, we have a ranking of the most diverse states in America.
And if you already knew these places were Hispanic, check out the best places to live in New Jersey or the safest places in New Jersey.
/10
Population: 67,258
# Of Hispanic/Latino Residents: 54,707
% Hispanic/Latino: 81.34%
More on Union City: Data | Crime | Cost Of Living | Real Estate

/10
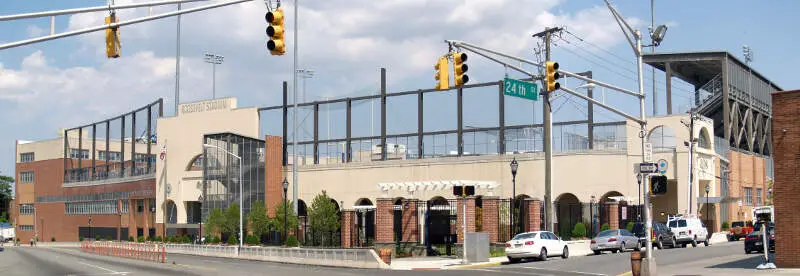
Population: 55,226
# Of Hispanic/Latino Residents: 43,513
% Hispanic/Latino: 78.79%
More on Perth Amboy: Data | Crime | Cost Of Living | Real Estate

/10
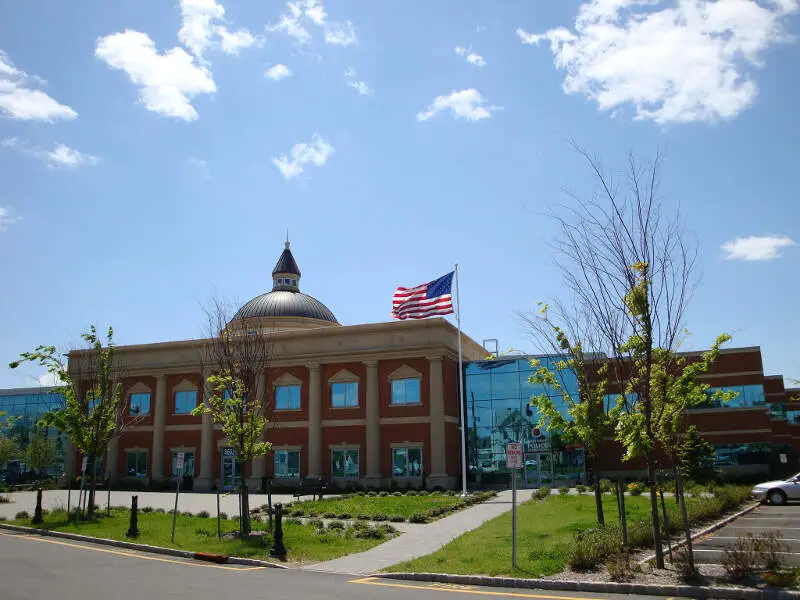
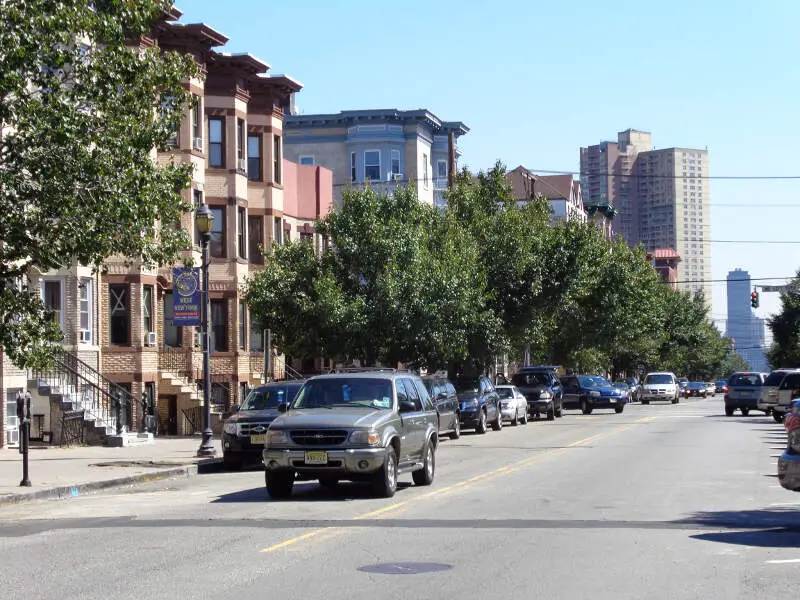
Population: 52,438
# Of Hispanic/Latino Residents: 40,475
% Hispanic/Latino: 77.19%
More on West New York: Data | Crime | Cost Of Living | Real Estate

/10
Population: 70,048
# Of Hispanic/Latino Residents: 51,885
% Hispanic/Latino: 74.07%
More on Passaic: Data | Crime | Cost Of Living | Real Estate

/10
Population: 18,426
# Of Hispanic/Latino Residents: 13,275
% Hispanic/Latino: 72.04%
More on Dover: Data | Crime | Cost Of Living | Real Estate

/10
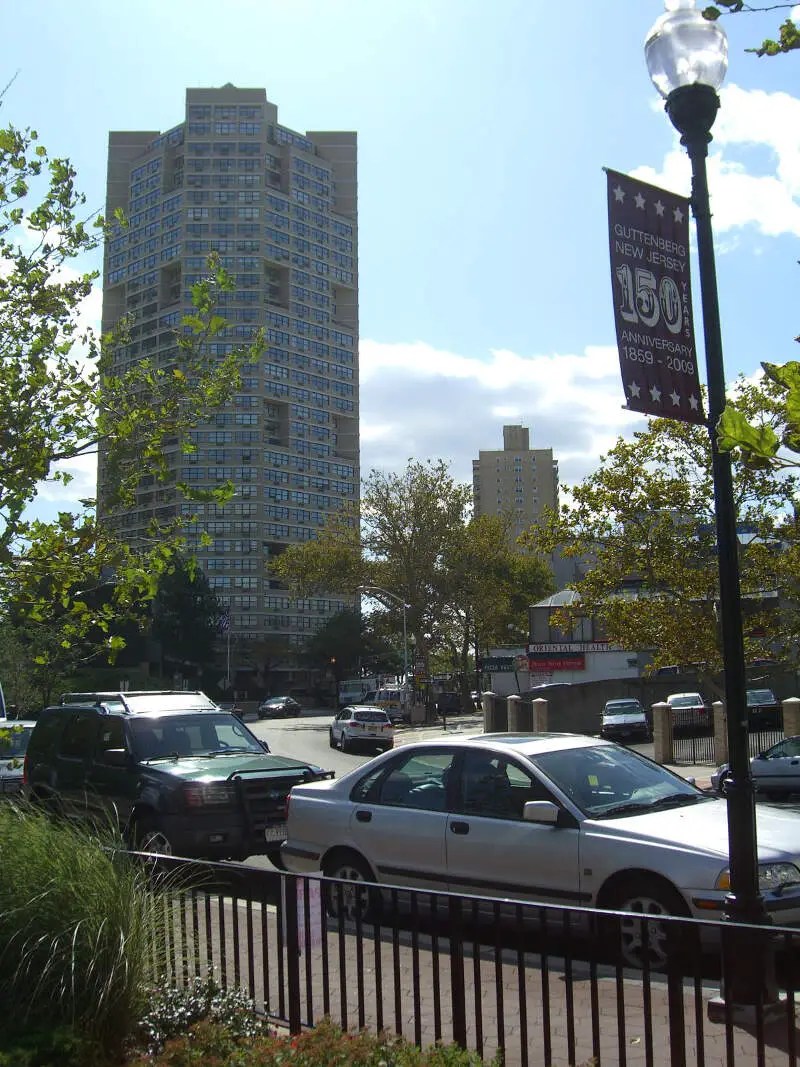
Population: 11,765
# Of Hispanic/Latino Residents: 7,917
% Hispanic/Latino: 67.29%
More on Guttenberg: Data | Crime | Cost Of Living | Real Estate

/10
Population: 135,665
# Of Hispanic/Latino Residents: 88,945
% Hispanic/Latino: 65.56%
More on Elizabeth: Data | Crime | Cost Of Living | Real Estate

/10
Population: 157,864
# Of Hispanic/Latino Residents: 99,537
% Hispanic/Latino: 63.05%
More on Paterson: Data | Crime | Cost Of Living | Real Estate

/10
Population: 6,299
# Of Hispanic/Latino Residents: 3,527
% Hispanic/Latino: 55.99%
More on Prospect Park: Data | Crime | Cost Of Living | Real Estate

/10
Population: 14,935
# Of Hispanic/Latino Residents: 8,215
% Hispanic/Latino: 55.01%
More on Fairview: Data | Crime | Cost Of Living | Real Estate
Methodology: How We Determined The Cities In New Jersey With The Largest Hispanic Population For 2024
We used Saturday Night Science to compare data on race from the US Census for every city in New Jersey.
New Jersey’s most recently available data comes from the 2018-2022 American Community Survey.
Specifically, we looked at table B03002: Hispanic OR LATINO ORIGIN BY RACE. Here are the category names as defined by the Census:
- Hispanic or Latino
- White alone*
- Black or African American alone*
- American Indian and Alaska Native alone*
- Asian alone*
- Native Hawaiian and Other Pacific Islander alone*
- Some other race alone*
- Two or more races*
Our particular column of interest here was the number of people who identified as Hispanic or Latino.
We limited our analysis to places in New Jersey with a population greater than 5,000 people. That left us with 251 cities.
We then calculated the percentage of Hispanic or Latino residents in each New Jersey city. The percentages ranked from 81.3% to 0.9%.
Finally, we ranked each city based on the percentage of the Hispanic or Latino population, with a higher score being more Hispanic or Latino than a lower score. Union City was the most Hispanic or Latino, while Little Silver was the least Hispanic or Latino city.
We updated this article for 2024. This article represents our tenth time ranking the cities in New Jersey with the largest Hispanic/Latino population.
Read on for more information on how the cities in New Jersey ranked by population of Hispanic or Latino residents or, for a more general take on diversity in America, head over to our ranking of the most diverse cities in America.
Summary: Hispanic or Latino Populations Across New Jersey
According to the most recent data, this is an accurate list if you’re looking for a breakdown of Latino populations for each place across New Jersey.
The most Hispanic/Latino cities in New Jersey are Union City, Perth Amboy, West New York, Passaic, Dover, Guttenberg, Elizabeth, Paterson, Prospect Park, and Fairview.
If you’re curious enough, here are the least Hispanic or Latino places in New Jersey:
- Little Silver
- Allendale
- Margate City
For more New Jersey reading, check out:
Most Hispanic Cities In New Jersey
| Rank | City | Population | Hispanic Pop. | % Hispanic |
|---|---|---|---|---|
| 1 | Union City | 67,258 | 54,707 | 81.34% |
| 2 | Perth Amboy | 55,226 | 43,513 | 78.79% |
| 3 | West New York | 52,438 | 40,475 | 77.19% |
| 4 | Passaic | 70,048 | 51,885 | 74.07% |
| 5 | Dover | 18,426 | 13,275 | 72.04% |
| 6 | Guttenberg | 11,765 | 7,917 | 67.29% |
| 7 | Elizabeth | 135,665 | 88,945 | 65.56% |
| 8 | Paterson | 157,864 | 99,537 | 63.05% |
| 9 | Prospect Park | 6,299 | 3,527 | 55.99% |
| 10 | Fairview | 14,935 | 8,215 | 55.01% |
| 11 | East Franklin | 9,309 | 5,119 | 54.99% |
| 12 | Kearny | 41,157 | 22,495 | 54.66% |
| 13 | Haledon | 8,945 | 4,874 | 54.49% |
| 14 | Camden | 71,799 | 38,264 | 53.29% |
| 15 | Bridgeton | 26,895 | 14,169 | 52.68% |
| 16 | Plainfield | 54,358 | 28,460 | 52.36% |
| 17 | Bound Brook | 11,906 | 6,146 | 51.62% |
| 18 | Ridgefield Park | 13,161 | 6,791 | 51.6% |
| 19 | Bogota | 8,940 | 4,498 | 50.31% |
| 20 | Wharton | 7,217 | 3,611 | 50.03% |
| 21 | Pleasantville | 20,562 | 10,004 | 48.65% |
| 22 | North Plainfield | 22,695 | 10,945 | 48.23% |
| 23 | New Brunswick | 55,718 | 26,118 | 46.88% |
| 24 | Harrison | 19,217 | 9,004 | 46.85% |
| 25 | Dunellen | 7,598 | 3,461 | 45.55% |
| 26 | Freehold | 12,498 | 5,622 | 44.98% |
| 27 | Vineland | 60,796 | 26,204 | 43.1% |
| 28 | Twin Rivers | 8,144 | 3,340 | 41.01% |
| 29 | Garfield | 32,472 | 13,115 | 40.39% |
| 30 | Lodi | 25,969 | 10,290 | 39.62% |
| 31 | Trenton | 90,055 | 34,866 | 38.72% |
| 32 | Clifton | 89,451 | 34,479 | 38.55% |
| 33 | Newark | 307,355 | 114,434 | 37.23% |
| 34 | Little Ferry | 10,954 | 4,051 | 36.98% |
| 35 | Hackensack | 45,758 | 16,847 | 36.82% |
| 36 | Cliffside Park | 25,546 | 9,246 | 36.19% |
| 37 | Ridgefield | 11,465 | 4,099 | 35.75% |
| 38 | Carteret | 25,161 | 8,868 | 35.25% |
| 39 | Bayonne | 70,497 | 24,469 | 34.71% |
| 40 | Linden | 43,478 | 14,968 | 34.43% |
| 41 | Roselle | 22,500 | 7,728 | 34.35% |
| 42 | Atlantic City | 38,487 | 12,867 | 33.43% |
| 43 | Roselle Park | 13,964 | 4,562 | 32.67% |
| 44 | Elmwood Park | 21,261 | 6,759 | 31.79% |
| 45 | Lindenwold | 21,337 | 6,713 | 31.46% |
| 46 | North Arlington | 16,352 | 5,059 | 30.94% |
| 47 | Hight | 5,864 | 1,814 | 30.93% |
| 48 | South River | 16,081 | 4,823 | 29.99% |
| 49 | Kenilworth | 8,345 | 2,487 | 29.8% |
| 50 | Jamesburg | 5,783 | 1,718 | 29.71% |
| 51 | Bergenfield | 28,223 | 8,237 | 29.19% |
| 52 | Englewood | 29,109 | 8,454 | 29.04% |
| 53 | Finderne | 5,881 | 1,680 | 28.57% |
| 54 | Woodland Park | 13,291 | 3,704 | 27.87% |
| 55 | Woodbridge | 20,927 | 5,719 | 27.33% |
| 56 | Jersey City | 287,899 | 78,263 | 27.18% |
| 57 | Fort Dix | 7,781 | 2,088 | 26.83% |
| 58 | Middlesex | 14,525 | 3,873 | 26.66% |
| 59 | Rahway | 29,664 | 7,745 | 26.11% |
| 60 | Morristown | 20,126 | 5,212 | 25.9% |
| 61 | Red Bank | 12,868 | 3,299 | 25.64% |
| 62 | Maywood | 10,040 | 2,526 | 25.16% |
| 63 | Wildwood | 5,164 | 1,299 | 25.15% |
| 64 | Hasbrouck Heights | 12,080 | 3,016 | 24.97% |
| 65 | Hammonton | 14,732 | 3,637 | 24.69% |
| 66 | Fords | 12,663 | 3,098 | 24.46% |
| 67 | South Amboy | 9,336 | 2,266 | 24.27% |
| 68 | North Haledon | 8,801 | 2,061 | 23.42% |
| 69 | Totowa | 10,975 | 2,570 | 23.42% |
| 70 | Hawthorne | 19,456 | 4,518 | 23.22% |
| 71 | Leonia | 9,273 | 2,145 | 23.13% |
| 72 | Somerville | 12,467 | 2,818 | 22.6% |
| 73 | Pomona | 8,878 | 1,997 | 22.49% |
| 74 | Butler | 8,045 | 1,774 | 22.05% |
| 75 | Dumont | 18,014 | 3,970 | 22.04% |
| 76 | Budd Lake | 9,983 | 2,153 | 21.57% |
| 77 | Long Branch | 31,932 | 6,866 | 21.5% |
| 78 | Rutherford | 18,754 | 3,973 | 21.18% |
| 79 | Avenel | 17,211 | 3,623 | 21.05% |
| 80 | Raritan | 8,301 | 1,742 | 20.99% |
| 81 | Secaucus | 21,470 | 4,448 | 20.72% |
| 82 | Westwood | 11,241 | 2,323 | 20.67% |
| 83 | Bloomingdale | 7,726 | 1,592 | 20.61% |
| 84 | Asbury Park | 15,245 | 3,140 | 20.6% |
| 85 | Wallington | 11,838 | 2,431 | 20.54% |
| 86 | Hackett | 10,111 | 2,075 | 20.52% |
| 87 | Rockaway | 6,589 | 1,346 | 20.43% |
| 88 | Sayreville | 45,136 | 9,112 | 20.19% |
| 89 | White Horse | 9,692 | 1,946 | 20.08% |
| 90 | Carlstadt | 6,341 | 1,253 | 19.76% |
| 91 | New Milford | 16,888 | 3,321 | 19.66% |
| 92 | Ramtown | 6,506 | 1,276 | 19.61% |
| 93 | Gloucester City | 11,435 | 2,150 | 18.8% |
| 94 | Brookdale | 10,312 | 1,935 | 18.76% |
| 95 | East Rutherford | 10,020 | 1,874 | 18.7% |
| 96 | Carneys Point | 8,136 | 1,520 | 18.68% |
| 97 | Palisades Park | 20,231 | 3,774 | 18.65% |
| 98 | South Plainfield | 24,273 | 4,476 | 18.44% |
| 99 | Madison Park | 8,291 | 1,520 | 18.33% |
| 100 | Hopatcong | 14,411 | 2,542 | 17.64% |