Tupelo, MS
Demographics And Statistics
Living In Tupelo, Mississippi Summary
Life in Tupelo research summary. HomeSnacks has been using Saturday Night Science to research the quality of life in Tupelo over the past nine years using Census, FBI, Zillow, and other primary data sources. Based on the most recently available data, we found the following about life in Tupelo:
The population in Tupelo is 37,939.
The median home value in Tupelo is $185,761.
The median income in Tupelo is $62,686.
The cost of living in Tupelo is 82 which is 0.8x lower than the national average.
The median rent in Tupelo is $922.
The unemployment rate in Tupelo is 5.1%.
The poverty rate in Tupelo is 13.5%.
The average high in Tupelo is 72.8° and the average low is 51.2°.
Table Of Contents
Tupelo SnackAbility
Overall SnackAbility
Tupelo, MS Cost Of Living
Cost of living in Tupelo summary. We use data on the cost of living to determine how expensive it is to live in Tupelo. Real estate prices drive most of the variance in cost of living around Mississippi. Key points include:
The cost of living in Tupelo is 82 with 100 being average.
The cost of living in Tupelo is 0.8x lower than the national average.
The median home value in Tupelo is $185,761.
The median income in Tupelo is $62,686.
Tupelo's Overall Cost Of Living
Lower Than The National Average
Cost Of Living In Tupelo Comparison Table
| Living Expense | Tupelo | Mississippi | National Average | |
|---|---|---|---|---|
| Overall | 82 | 86 | 100 | |
| Services | 91 | 92 | 100 | |
| Groceries | 89 | 94 | 100 | |
| Health | 89 | 98 | 100 | |
| Housing | 74 | 69 | 100 | |
| Transportation | 89 | 91 | 100 | |
| Utilities | 87 | 87 | 100 | |
Tupelo, MS Weather
The average high in Tupelo is 72.8° and the average low is 51.2°.
There are 77.2 days of precipitation each year.
Expect an average of 56.6 inches of precipitation each year with 1.3 inches of snow.
| Stat | Tupelo |
|---|---|
| Average Annual High | 72.8 |
| Average Annual Low | 51.2 |
| Annual Precipitation Days | 77.2 |
| Average Annual Precipitation | 56.6 |
| Average Annual Snowfall | 1.3 |
Average High
Days of Rain
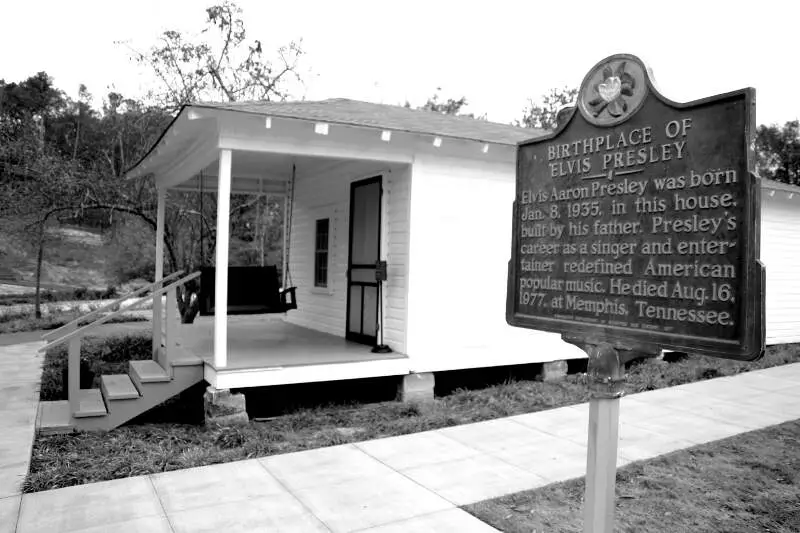
Tupelo, MS Photos


Rankings for Tupelo in Mississippi


Locations Around Tupelo
Map Of Tupelo, MS
Best Places Around Tupelo
Oxford, MS
Population 25,713
New Albany, MS
Population 7,657
Ripley, MS
Population 5,440
Corinth, MS
Population 14,520
Amory, MS
Population 6,642
Booneville, MS
Population 9,027
Pontotoc, MS
Population 5,676
West Point, MS
Population 10,063
Aberdeen, MS
Population 4,972
Tupelo Demographics And Statistics
Population over time in Tupelo
The current population in Tupelo is 37,939. The population has increased 10.4% from 2010.
| Year | Population | % Change |
|---|---|---|
| 2022 | 37,939 | -0.9% |
| 2021 | 38,270 | -0.1% |
| 2020 | 38,321 | -1.4% |
| 2019 | 38,856 | 9.3% |
| 2018 | 35,561 | 0.6% |
| 2017 | 35,345 | 0.6% |
| 2016 | 35,143 | 0.9% |
| 2015 | 34,827 | 0.8% |
| 2014 | 34,551 | 0.5% |
| 2013 | 34,363 | - |
Race / Ethnicity in Tupelo
Tupelo is:
54.2% White with 20,547 White residents.
38.3% African American with 14,537 African American residents.
0.2% American Indian with 57 American Indian residents.
0.5% Asian with 196 Asian residents.
0.4% Hawaiian with 166 Hawaiian residents.
0.9% Other with 354 Other residents.
2.1% Two Or More with 812 Two Or More residents.
3.3% Hispanic with 1,270 Hispanic residents.
| Race | Tupelo | MS | USA |
|---|---|---|---|
| White | 54.2% | 55.9% | 58.9% |
| African American | 38.3% | 37.1% | 12.1% |
| American Indian | 0.2% | 0.4% | 0.6% |
| Asian | 0.5% | 1.0% | 5.7% |
| Hawaiian | 0.4% | 0.0% | 0.2% |
| Other | 0.9% | 0.3% | 0.4% |
| Two Or More | 2.1% | 2.1% | 3.5% |
| Hispanic | 3.3% | 3.3% | 18.7% |
Gender in Tupelo
Tupelo is 54.4% female with 20,626 female residents.
Tupelo is 45.6% male with 17,313 male residents.
| Gender | Tupelo | MS | USA |
|---|---|---|---|
| Female | 54.4% | 51.4% | 50.4% |
| Male | 45.6% | 48.6% | 49.6% |
Highest level of educational attainment in Tupelo for adults over 25
3.0% of adults in Tupelo completed < 9th grade.
7.0% of adults in Tupelo completed 9-12th grade.
22.0% of adults in Tupelo completed high school / ged.
21.0% of adults in Tupelo completed some college.
11.0% of adults in Tupelo completed associate's degree.
22.0% of adults in Tupelo completed bachelor's degree.
9.0% of adults in Tupelo completed master's degree.
3.0% of adults in Tupelo completed professional degree.
2.0% of adults in Tupelo completed doctorate degree.
| Education | Tupelo | MS | USA |
|---|---|---|---|
| < 9th Grade | 3.0% | 3.0% | 4.0% |
| 9-12th Grade | 7.0% | 9.0% | 6.0% |
| High School / GED | 22.0% | 30.0% | 26.0% |
| Some College | 21.0% | 22.0% | 20.0% |
| Associate's Degree | 11.0% | 11.0% | 9.0% |
| Bachelor's Degree | 22.0% | 15.0% | 21.0% |
| Master's Degree | 9.0% | 7.0% | 10.0% |
| Professional Degree | 3.0% | 2.0% | 2.0% |
| Doctorate Degree | 2.0% | 1.0% | 2.0% |
Household Income For Tupelo, Mississippi
5.5% of households in Tupelo earn Less than $10,000.
5.9% of households in Tupelo earn $10,000 to $14,999.
8.7% of households in Tupelo earn $15,000 to $24,999.
9.0% of households in Tupelo earn $25,000 to $34,999.
11.7% of households in Tupelo earn $35,000 to $49,999.
15.5% of households in Tupelo earn $50,000 to $74,999.
12.8% of households in Tupelo earn $75,000 to $99,999.
17.9% of households in Tupelo earn $100,000 to $149,999.
4.8% of households in Tupelo earn $150,000 to $199,999.
8.3% of households in Tupelo earn $200,000 or more.
| Income | Tupelo | MS | USA |
|---|---|---|---|
| Less than $10,000 | 5.5% | 7.4% | 4.9% |
| $10,000 to $14,999 | 5.9% | 6.4% | 3.8% |
| $15,000 to $24,999 | 8.7% | 11.0% | 7.0% |
| $25,000 to $34,999 | 9.0% | 9.8% | 7.4% |
| $35,000 to $49,999 | 11.7% | 13.1% | 10.7% |
| $50,000 to $74,999 | 15.5% | 16.7% | 16.1% |
| $75,000 to $99,999 | 12.8% | 12.0% | 12.8% |
| $100,000 to $149,999 | 17.9% | 13.3% | 17.1% |
| $150,000 to $199,999 | 4.8% | 5.5% | 8.8% |
| $200,000 or more | 8.3% | 4.7% | 11.4% |


