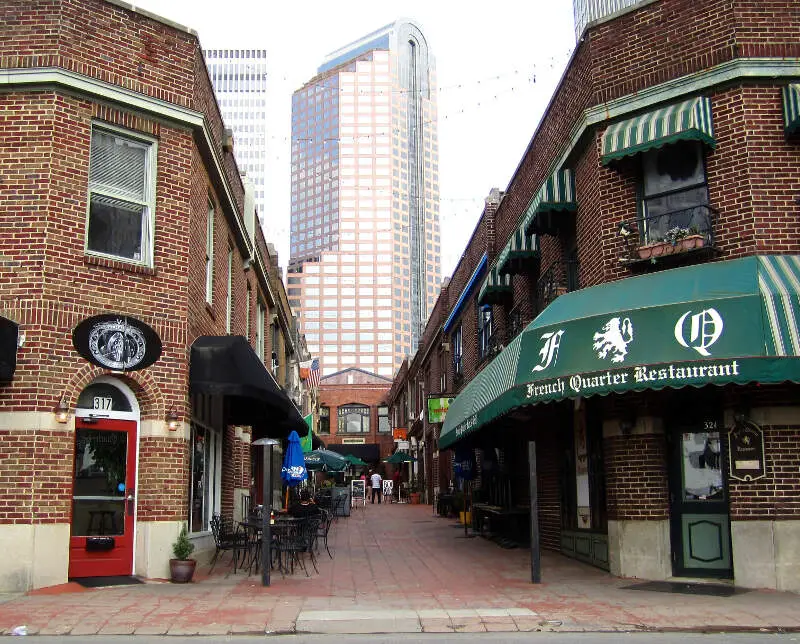
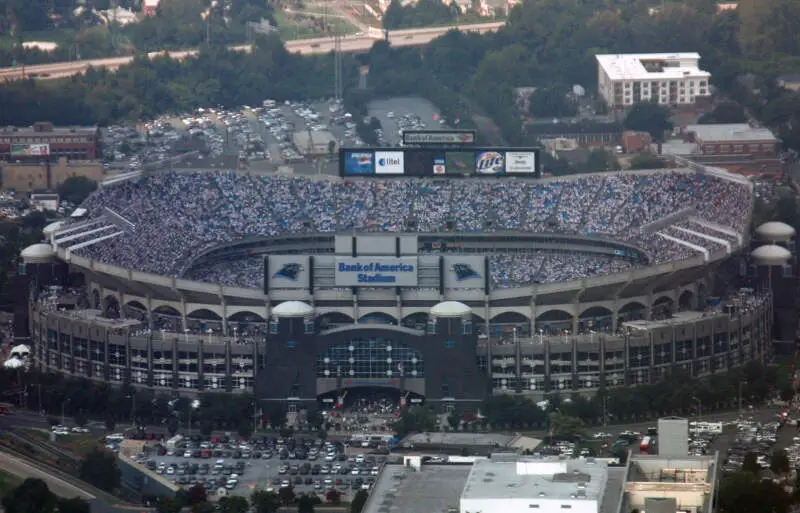
Charlotte, NC
Demographics And Statistics
Living In Charlotte, North Carolina Summary
Life in Charlotte research summary. HomeSnacks has been using Saturday Night Science to research the quality of life in Charlotte over the past nine years using Census, FBI, Zillow, and other primary data sources. Based on the most recently available data, we found the following about life in Charlotte:
The population in Charlotte is 875,045.
The median home value in Charlotte is $387,529.
The median income in Charlotte is $74,070.
The cost of living in Charlotte is 98 which is 1.0x lower than the national average.
The median rent in Charlotte is $1,399.
The unemployment rate in Charlotte is 4.7%.
The poverty rate in Charlotte is 11.7%.
The average high in Charlotte is 71.4° and the average low is 49.8°.
Table Of Contents
Charlotte SnackAbility
Overall SnackAbility
Charlotte, NC Cost Of Living
Cost of living in Charlotte summary. We use data on the cost of living to determine how expensive it is to live in Charlotte. Real estate prices drive most of the variance in cost of living around North Carolina. Key points include:
The cost of living in Charlotte is 98 with 100 being average.
The cost of living in Charlotte is 1.0x lower than the national average.
The median home value in Charlotte is $387,529.
The median income in Charlotte is $74,070.
Charlotte's Overall Cost Of Living
Lower Than The National Average
Cost Of Living In Charlotte Comparison Table
| Living Expense | Charlotte | North Carolina | National Average | |
|---|---|---|---|---|
| Overall | 98 | 95 | 100 | |
| Services | 107 | 97 | 100 | |
| Groceries | 95 | 98 | 100 | |
| Health | 112 | 108 | 100 | |
| Housing | 99 | 91 | 100 | |
| Transportation | 91 | 92 | 100 | |
| Utilities | 94 | 95 | 100 | |
Charlotte, NC Weather
The average high in Charlotte is 71.4° and the average low is 49.8°.
There are 70.4 days of precipitation each year.
Expect an average of 43.4 inches of precipitation each year with 2.5 inches of snow.
| Stat | Charlotte |
|---|---|
| Average Annual High | 71.4 |
| Average Annual Low | 49.8 |
| Annual Precipitation Days | 70.4 |
| Average Annual Precipitation | 43.4 |
| Average Annual Snowfall | 2.5 |
Average High
Days of Rain
Charlotte, NC Photos


2 Reviews & Comments About Charlotte
/5

Ayanna Michelle -
i live in Charlotte and i have my whole life and i still wonder why the h**l charlotte isn't the capital yet ! why the hellllll is raleigh our capital -
HomeSnacks User - 2018-09-10 13:06:29.467076
Charlotte is a beautiful place. I enjoyed my time at the theme park with water rides called Carowinds. I'm a car lover as well so I decided to go to the NASCAR Hall of fame!
I'm into science and I loved my trip to the Science museum. The Freedom Park is an amazing place as well, especially for hiking sports and lakeside events!
Charlotte Articles


Rankings for Charlotte in North Carolina

Locations Around Charlotte
Map Of Charlotte, NC
Best Places Around Charlotte
Matthews, NC
Population 29,613
Davidson, NC
Population 15,199
Cornelius, NC
Population 31,396
Harrisburg, NC
Population 18,934
Marvin, NC
Population 6,421
Stallings, NC
Population 16,193
Indian Trail, NC
Population 40,325
Wesley Chapel, NC
Population 8,763
Weddington, NC
Population 13,173
Huntersville, NC
Population 61,202
Charlotte Demographics And Statistics
Population over time in Charlotte
The current population in Charlotte is 875,045. The population has increased 24.0% from 2010.
| Year | Population | % Change |
|---|---|---|
| 2022 | 875,045 | 4.0% |
| 2021 | 841,611 | 1.9% |
| 2020 | 826,060 | 2.1% |
| 2019 | 808,834 | 2.1% |
| 2018 | 792,137 | 2.2% |
| 2017 | 774,807 | 2.3% |
| 2016 | 757,278 | 2.2% |
| 2015 | 740,931 | 2.6% |
| 2014 | 722,234 | 2.3% |
| 2013 | 705,896 | - |
Race / Ethnicity in Charlotte
Charlotte is:
39.7% White with 347,363 White residents.
34.7% African American with 303,980 African American residents.
0.2% American Indian with 1,575 American Indian residents.
6.5% Asian with 56,768 Asian residents.
0.0% Hawaiian with 230 Hawaiian residents.
0.4% Other with 3,315 Other residents.
3.2% Two Or More with 27,756 Two Or More residents.
15.3% Hispanic with 134,058 Hispanic residents.
| Race | Charlotte | NC | USA |
|---|---|---|---|
| White | 39.7% | 61.7% | 58.9% |
| African American | 34.7% | 20.6% | 12.1% |
| American Indian | 0.2% | 0.9% | 0.6% |
| Asian | 6.5% | 3.1% | 5.7% |
| Hawaiian | 0.0% | 0.1% | 0.2% |
| Other | 0.4% | 0.4% | 0.4% |
| Two Or More | 3.2% | 3.3% | 3.5% |
| Hispanic | 15.3% | 10.0% | 18.7% |
Gender in Charlotte
Charlotte is 51.5% female with 450,872 female residents.
Charlotte is 48.5% male with 424,173 male residents.
| Gender | Charlotte | NC | USA |
|---|---|---|---|
| Female | 51.5% | 51.0% | 50.4% |
| Male | 48.5% | 49.0% | 49.6% |
Highest level of educational attainment in Charlotte for adults over 25
5.0% of adults in Charlotte completed < 9th grade.
5.0% of adults in Charlotte completed 9-12th grade.
17.0% of adults in Charlotte completed high school / ged.
19.0% of adults in Charlotte completed some college.
8.0% of adults in Charlotte completed associate's degree.
30.0% of adults in Charlotte completed bachelor's degree.
12.0% of adults in Charlotte completed master's degree.
3.0% of adults in Charlotte completed professional degree.
1.0% of adults in Charlotte completed doctorate degree.
| Education | Charlotte | NC | USA |
|---|---|---|---|
| < 9th Grade | 5.0% | 5.0% | 4.0% |
| 9-12th Grade | 5.0% | 7.0% | 6.0% |
| High School / GED | 17.0% | 25.0% | 26.0% |
| Some College | 19.0% | 20.0% | 20.0% |
| Associate's Degree | 8.0% | 10.0% | 9.0% |
| Bachelor's Degree | 30.0% | 21.0% | 21.0% |
| Master's Degree | 12.0% | 9.0% | 10.0% |
| Professional Degree | 3.0% | 2.0% | 2.0% |
| Doctorate Degree | 1.0% | 1.0% | 2.0% |
Household Income For Charlotte, North Carolina
4.3% of households in Charlotte earn Less than $10,000.
3.0% of households in Charlotte earn $10,000 to $14,999.
6.0% of households in Charlotte earn $15,000 to $24,999.
7.4% of households in Charlotte earn $25,000 to $34,999.
11.8% of households in Charlotte earn $35,000 to $49,999.
18.2% of households in Charlotte earn $50,000 to $74,999.
12.5% of households in Charlotte earn $75,000 to $99,999.
16.2% of households in Charlotte earn $100,000 to $149,999.
8.3% of households in Charlotte earn $150,000 to $199,999.
12.4% of households in Charlotte earn $200,000 or more.
| Income | Charlotte | NC | USA |
|---|---|---|---|
| Less than $10,000 | 4.3% | 5.1% | 4.9% |
| $10,000 to $14,999 | 3.0% | 4.3% | 3.8% |
| $15,000 to $24,999 | 6.0% | 8.1% | 7.0% |
| $25,000 to $34,999 | 7.4% | 8.5% | 7.4% |
| $35,000 to $49,999 | 11.8% | 12.3% | 10.7% |
| $50,000 to $74,999 | 18.2% | 17.3% | 16.1% |
| $75,000 to $99,999 | 12.5% | 12.9% | 12.8% |
| $100,000 to $149,999 | 16.2% | 15.9% | 17.1% |
| $150,000 to $199,999 | 8.3% | 7.2% | 8.8% |
| $200,000 or more | 12.4% | 8.5% | 11.4% |


