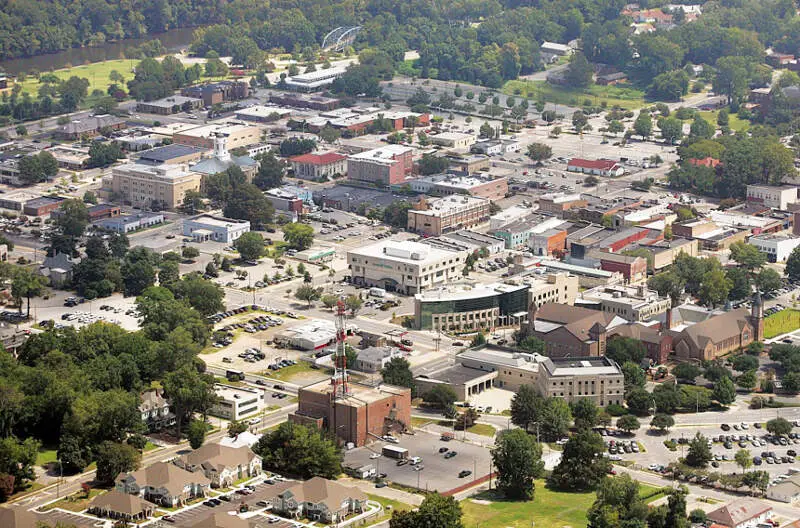
Greenville, NC
Demographics And Statistics
Living In Greenville, North Carolina Summary
Life in Greenville research summary. HomeSnacks has been using Saturday Night Science to research the quality of life in Greenville over the past nine years using Census, FBI, Zillow, and other primary data sources. Based on the most recently available data, we found the following about life in Greenville:
The population in Greenville is 87,894.
The median home value in Greenville is $229,462.
The median income in Greenville is $47,485.
The cost of living in Greenville is 92 which is 0.9x lower than the national average.
The median rent in Greenville is $933.
The unemployment rate in Greenville is 8.7%.
The poverty rate in Greenville is 25.2%.
The average high in Greenville is 72.5° and the average low is 50.3°.
Greenville SnackAbility
Overall SnackAbility
Greenville, NC Crime Report
Crime in Greenville summary. We use data from the FBI to determine the crime rates in Greenville. Key points include:
There were 2,946 total crimes in Greenville in the last reporting year.
The overall crime rate per 100,000 people in Greenville is 3,296.7 / 100k people.
The violent crime rate per 100,000 people in Greenville is 568.5 / 100k people.
The property crime rate per 100,000 people in Greenville is 2,728.2 / 100k people.
Overall, crime in Greenville is 41.84% above the national average.
Total Crimes
Above National Average
Crime In Greenville Comparison Table
| Statistic | Count Raw |
Greenville / 100k People |
North Carolina / 100k People |
National / 100k People |
|---|---|---|---|---|
| Total Crimes Per 100K | 2,946 | 3,296.7 | 2,645.8 | 2,324.2 |
| Violent Crime | 508 | 568.5 | 419.3 | 369.8 |
| Murder | 12 | 13.4 | 8.0 | 6.3 |
| Robbery | 67 | 75.0 | 69.2 | 66.1 |
| Aggravated Assault | 407 | 455.4 | 314.5 | 268.2 |
| Property Crime | 2,438 | 2,728.2 | 2,226.5 | 1,954.4 |
| Burglary | 273 | 305.5 | 471.2 | 269.8 |
| Larceny | 2,017 | 2,257.1 | 1,561.7 | 1,401.9 |
| Car Theft | 148 | 165.6 | 193.6 | 282.7 |
Greenville, NC Cost Of Living
Cost of living in Greenville summary. We use data on the cost of living to determine how expensive it is to live in Greenville. Real estate prices drive most of the variance in cost of living around North Carolina. Key points include:
The cost of living in Greenville is 92 with 100 being average.
The cost of living in Greenville is 0.9x lower than the national average.
The median home value in Greenville is $229,462.
The median income in Greenville is $47,485.
Greenville's Overall Cost Of Living
Lower Than The National Average
Cost Of Living In Greenville Comparison Table
| Living Expense | Greenville | North Carolina | National Average | |
|---|---|---|---|---|
| Overall | 92 | 95 | 100 | |
| Services | 96 | 97 | 100 | |
| Groceries | 93 | 98 | 100 | |
| Health | 102 | 108 | 100 | |
| Housing | 82 | 91 | 100 | |
| Transportation | 93 | 92 | 100 | |
| Utilities | 100 | 95 | 100 | |
Greenville, NC Weather
The average high in Greenville is 72.5° and the average low is 50.3°.
There are 75.3 days of precipitation each year.
Expect an average of 48.9 inches of precipitation each year with 3.0 inches of snow.
| Stat | Greenville |
|---|---|
| Average Annual High | 72.5 |
| Average Annual Low | 50.3 |
| Annual Precipitation Days | 75.3 |
| Average Annual Precipitation | 48.9 |
| Average Annual Snowfall | 3.0 |
Average High
Days of Rain
Greenville, NC Photos
1 Reviews & Comments About Greenville
/5

Linwood Whitehurst -
I live in Greenville NC Greenville is not all that dangerous
Rankings for Greenville in North Carolina


Locations Around Greenville
Map Of Greenville, NC
Best Places Around Greenville
Winterville, NC
Population 10,510
Nashville, NC
Population 5,624
Washington, NC
Population 9,759
New Bern, NC
Population 31,373
Wilson, NC
Population 47,767
Williamston, NC
Population 5,224
Rocky Mount, NC
Population 54,260
Goldsboro, NC
Population 33,566
Kinston, NC
Population 19,704
Tarboro, NC
Population 10,696
Greenville Demographics And Statistics
Population over time in Greenville
The current population in Greenville is 87,894. The population has increased 9.3% from 2010.
| Year | Population | % Change |
|---|---|---|
| 2022 | 87,894 | -3.6% |
| 2021 | 91,207 | 1.0% |
| 2020 | 90,347 | 0.7% |
| 2019 | 89,745 | 1.3% |
| 2018 | 88,598 | 1.2% |
| 2017 | 87,546 | 1.5% |
| 2016 | 86,249 | 2.1% |
| 2015 | 84,445 | 2.3% |
| 2014 | 82,576 | 2.7% |
| 2013 | 80,439 | - |
Race / Ethnicity in Greenville
Greenville is:
49.1% White with 43,156 White residents.
40.0% African American with 35,177 African American residents.
0.1% American Indian with 118 American Indian residents.
2.9% Asian with 2,513 Asian residents.
0.0% Hawaiian with 0 Hawaiian residents.
0.2% Other with 207 Other residents.
3.4% Two Or More with 3,021 Two Or More residents.
4.2% Hispanic with 3,702 Hispanic residents.
| Race | Greenville | NC | USA |
|---|---|---|---|
| White | 49.1% | 61.7% | 58.9% |
| African American | 40.0% | 20.6% | 12.1% |
| American Indian | 0.1% | 0.9% | 0.6% |
| Asian | 2.9% | 3.1% | 5.7% |
| Hawaiian | 0.0% | 0.1% | 0.2% |
| Other | 0.2% | 0.4% | 0.4% |
| Two Or More | 3.4% | 3.3% | 3.5% |
| Hispanic | 4.2% | 10.0% | 18.7% |
Gender in Greenville
Greenville is 54.7% female with 48,039 female residents.
Greenville is 45.3% male with 39,855 male residents.
| Gender | Greenville | NC | USA |
|---|---|---|---|
| Female | 54.7% | 51.0% | 50.4% |
| Male | 45.3% | 49.0% | 49.6% |
Highest level of educational attainment in Greenville for adults over 25
1.0% of adults in Greenville completed < 9th grade.
4.0% of adults in Greenville completed 9-12th grade.
23.0% of adults in Greenville completed high school / ged.
18.0% of adults in Greenville completed some college.
14.0% of adults in Greenville completed associate's degree.
22.0% of adults in Greenville completed bachelor's degree.
11.0% of adults in Greenville completed master's degree.
4.0% of adults in Greenville completed professional degree.
3.0% of adults in Greenville completed doctorate degree.
| Education | Greenville | NC | USA |
|---|---|---|---|
| < 9th Grade | 1.0% | 5.0% | 4.0% |
| 9-12th Grade | 4.0% | 7.0% | 6.0% |
| High School / GED | 23.0% | 25.0% | 26.0% |
| Some College | 18.0% | 20.0% | 20.0% |
| Associate's Degree | 14.0% | 10.0% | 9.0% |
| Bachelor's Degree | 22.0% | 21.0% | 21.0% |
| Master's Degree | 11.0% | 9.0% | 10.0% |
| Professional Degree | 4.0% | 2.0% | 2.0% |
| Doctorate Degree | 3.0% | 1.0% | 2.0% |
Household Income For Greenville, North Carolina
10.3% of households in Greenville earn Less than $10,000.
6.8% of households in Greenville earn $10,000 to $14,999.
9.2% of households in Greenville earn $15,000 to $24,999.
9.2% of households in Greenville earn $25,000 to $34,999.
16.4% of households in Greenville earn $35,000 to $49,999.
17.4% of households in Greenville earn $50,000 to $74,999.
10.9% of households in Greenville earn $75,000 to $99,999.
10.6% of households in Greenville earn $100,000 to $149,999.
4.1% of households in Greenville earn $150,000 to $199,999.
5.1% of households in Greenville earn $200,000 or more.
| Income | Greenville | NC | USA |
|---|---|---|---|
| Less than $10,000 | 10.3% | 5.1% | 4.9% |
| $10,000 to $14,999 | 6.8% | 4.3% | 3.8% |
| $15,000 to $24,999 | 9.2% | 8.1% | 7.0% |
| $25,000 to $34,999 | 9.2% | 8.5% | 7.4% |
| $35,000 to $49,999 | 16.4% | 12.3% | 10.7% |
| $50,000 to $74,999 | 17.4% | 17.3% | 16.1% |
| $75,000 to $99,999 | 10.9% | 12.9% | 12.8% |
| $100,000 to $149,999 | 10.6% | 15.9% | 17.1% |
| $150,000 to $199,999 | 4.1% | 7.2% | 8.8% |
| $200,000 or more | 5.1% | 8.5% | 11.4% |


