Raleigh, NC
Demographics And Statistics
Living In Raleigh, North Carolina Summary
Life in Raleigh research summary. HomeSnacks has been using Saturday Night Science to research the quality of life in Raleigh over the past nine years using Census, FBI, Zillow, and other primary data sources. Based on the most recently available data, we found the following about life in Raleigh:
The population in Raleigh is 465,517.
The median home value in Raleigh is $431,992.
The median income in Raleigh is $78,631.
The cost of living in Raleigh is 102 which is 1.0x higher than the national average.
The median rent in Raleigh is $1,371.
The unemployment rate in Raleigh is 4.5%.
The poverty rate in Raleigh is 11.8%.
The average high in Raleigh is 71.0° and the average low is 48.5°.
Raleigh SnackAbility
Overall SnackAbility
Raleigh, NC Crime Report
Crime in Raleigh summary. We use data from the FBI to determine the crime rates in Raleigh. Key points include:
There were 13,345 total crimes in Raleigh in the last reporting year.
The overall crime rate per 100,000 people in Raleigh is 2,834.4 / 100k people.
The violent crime rate per 100,000 people in Raleigh is 499.8 / 100k people.
The property crime rate per 100,000 people in Raleigh is 2,334.6 / 100k people.
Overall, crime in Raleigh is 21.95% above the national average.
Total Crimes
Above National Average
Crime In Raleigh Comparison Table
| Statistic | Count Raw |
Raleigh / 100k People |
North Carolina / 100k People |
National / 100k People |
|---|---|---|---|---|
| Total Crimes Per 100K | 13,345 | 2,834.4 | 2,645.8 | 2,324.2 |
| Violent Crime | 2,353 | 499.8 | 419.3 | 369.8 |
| Murder | 44 | 9.3 | 8.0 | 6.3 |
| Robbery | 439 | 93.2 | 69.2 | 66.1 |
| Aggravated Assault | 1,696 | 360.2 | 314.5 | 268.2 |
| Property Crime | 10,992 | 2,334.6 | 2,226.5 | 1,954.4 |
| Burglary | 1,207 | 256.4 | 471.2 | 269.8 |
| Larceny | 8,584 | 1,823.2 | 1,561.7 | 1,401.9 |
| Car Theft | 1,201 | 255.1 | 193.6 | 282.7 |
Raleigh, NC Cost Of Living
Cost of living in Raleigh summary. We use data on the cost of living to determine how expensive it is to live in Raleigh. Real estate prices drive most of the variance in cost of living around North Carolina. Key points include:
The cost of living in Raleigh is 102 with 100 being average.
The cost of living in Raleigh is 1.0x higher than the national average.
The median home value in Raleigh is $431,992.
The median income in Raleigh is $78,631.
Raleigh's Overall Cost Of Living
Higher Than The National Average
Cost Of Living In Raleigh Comparison Table
| Living Expense | Raleigh | North Carolina | National Average | |
|---|---|---|---|---|
| Overall | 102 | 95 | 100 | |
| Services | 96 | 97 | 100 | |
| Groceries | 93 | 98 | 100 | |
| Health | 105 | 108 | 100 | |
| Housing | 114 | 91 | 100 | |
| Transportation | 96 | 92 | 100 | |
| Utilities | 101 | 95 | 100 | |
Raleigh, NC Weather
The average high in Raleigh is 71.0° and the average low is 48.5°.
There are 74.1 days of precipitation each year.
Expect an average of 45.6 inches of precipitation each year with 3.7 inches of snow.
| Stat | Raleigh |
|---|---|
| Average Annual High | 71.0 |
| Average Annual Low | 48.5 |
| Annual Precipitation Days | 74.1 |
| Average Annual Precipitation | 45.6 |
| Average Annual Snowfall | 3.7 |
Average High
Days of Rain
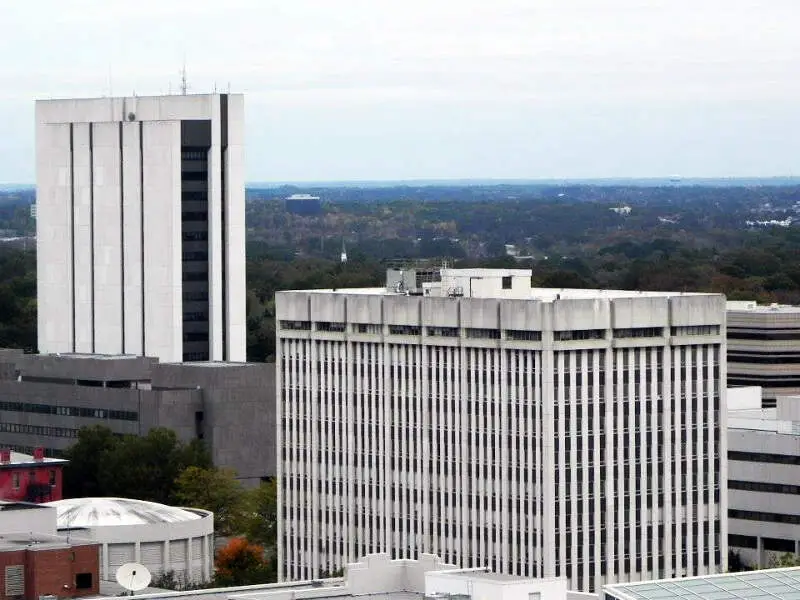
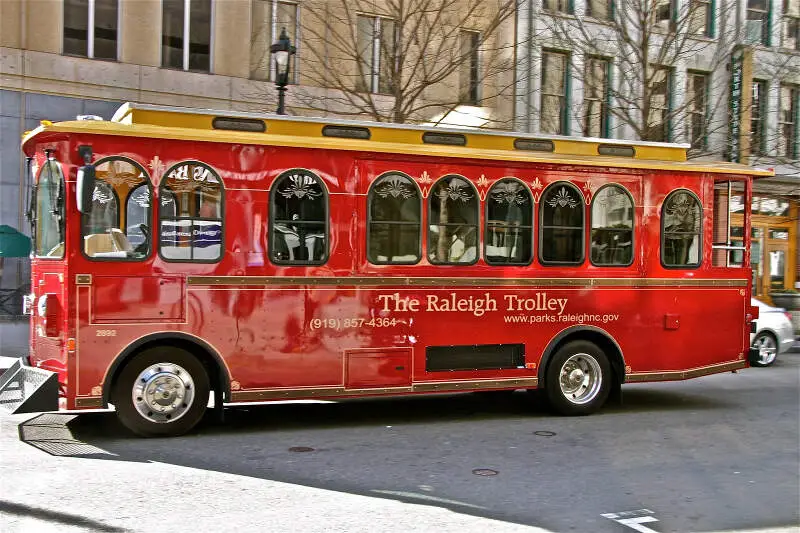
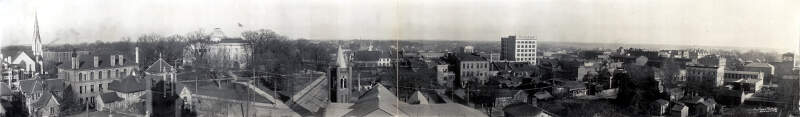
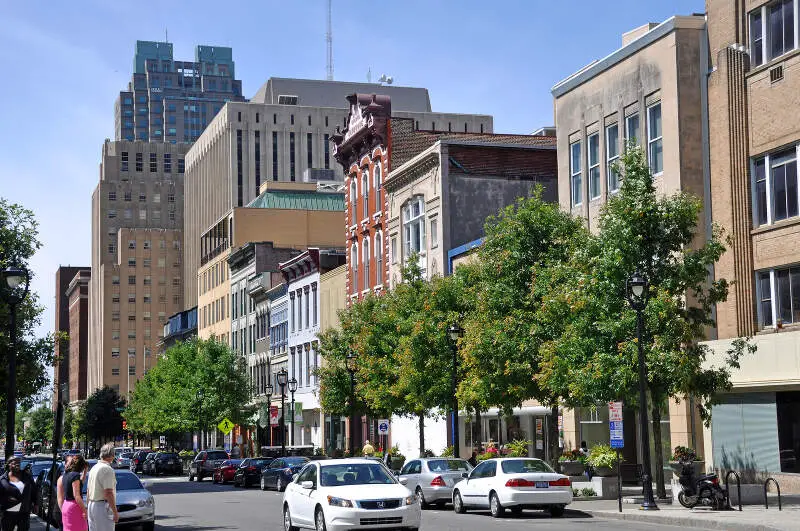
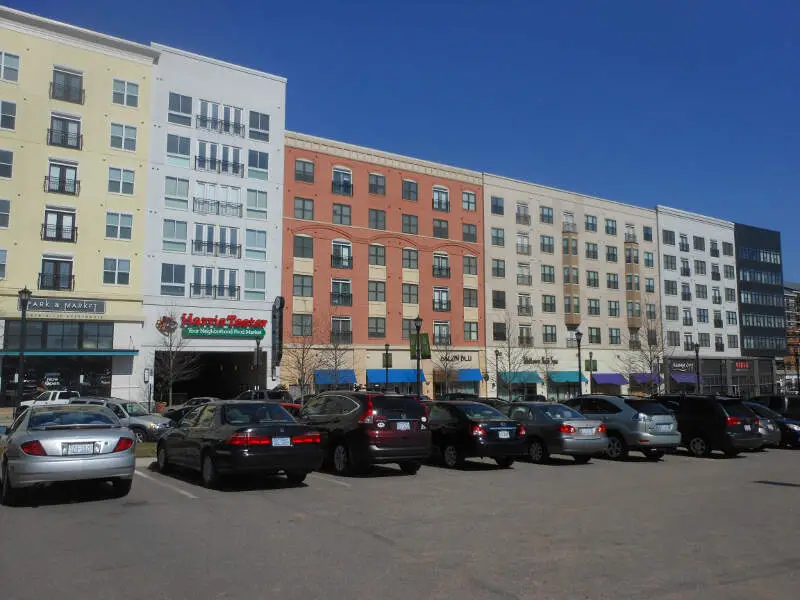
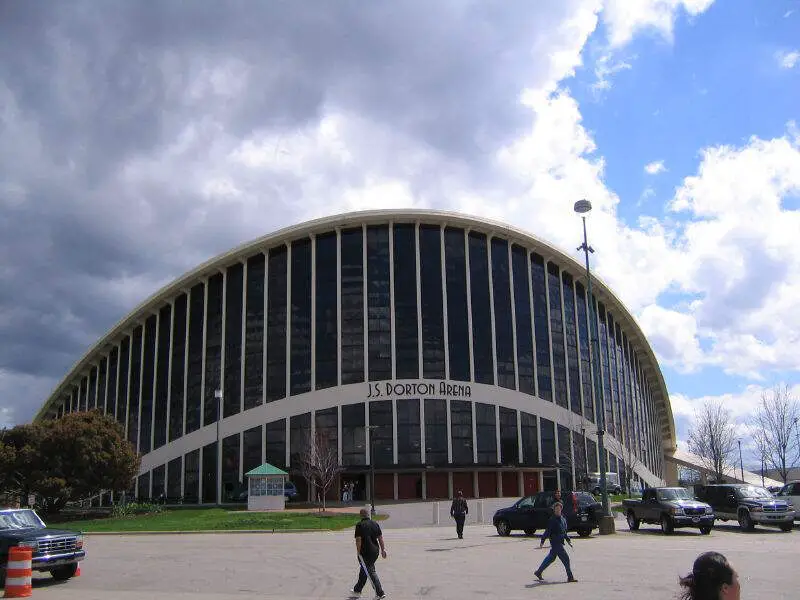
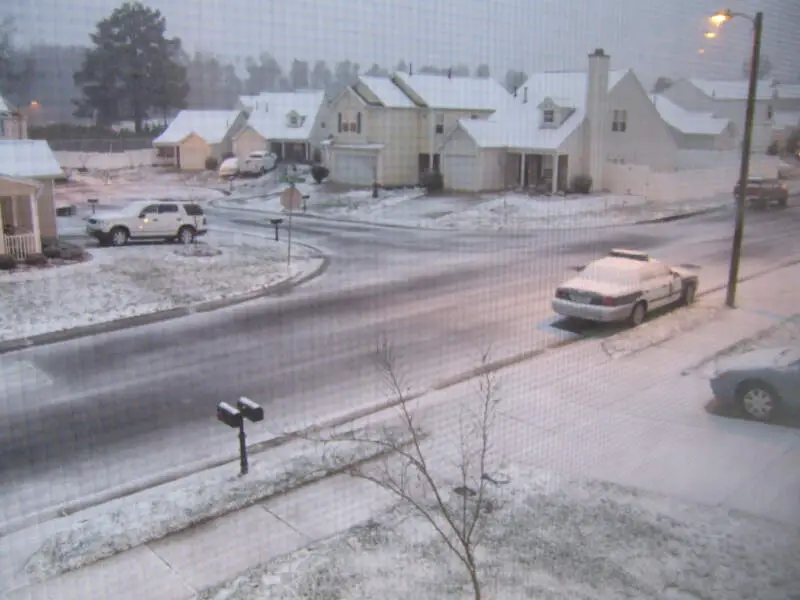
Raleigh, NC Photos


Raleigh Articles


Rankings for Raleigh in North Carolina
Locations Around Raleigh
Map Of Raleigh, NC
Best Places Around Raleigh
Cary, NC
Population 174,880
Apex, NC
Population 65,541
Wake Forest, NC
Population 48,047
Morrisville, NC
Population 29,756
Holly Springs, NC
Population 42,023
Garner, NC
Population 31,684
Knightdale, NC
Population 19,127
Fuquay-Varina, NC
Population 35,428
Durham, NC
Population 284,094
Clayton, NC
Population 26,837
Raleigh Demographics And Statistics
Population over time in Raleigh
The current population in Raleigh is 465,517. The population has increased 21.6% from 2010.
| Year | Population | % Change |
|---|---|---|
| 2022 | 465,517 | 1.8% |
| 2021 | 457,159 | 1.7% |
| 2020 | 449,477 | 1.8% |
| 2019 | 441,326 | 2.0% |
| 2018 | 432,520 | 2.2% |
| 2017 | 423,287 | 2.1% |
| 2016 | 414,530 | 2.4% |
| 2015 | 405,007 | 2.5% |
| 2014 | 395,091 | 3.2% |
| 2013 | 382,729 | - |
Race / Ethnicity in Raleigh
Raleigh is:
52.5% White with 244,236 White residents.
27.5% African American with 127,830 African American residents.
0.2% American Indian with 873 American Indian residents.
4.5% Asian with 21,044 Asian residents.
0.0% Hawaiian with 119 Hawaiian residents.
0.4% Other with 1,633 Other residents.
3.4% Two Or More with 15,745 Two Or More residents.
11.6% Hispanic with 54,037 Hispanic residents.
| Race | Raleigh | NC | USA |
|---|---|---|---|
| White | 52.5% | 61.7% | 58.9% |
| African American | 27.5% | 20.6% | 12.1% |
| American Indian | 0.2% | 0.9% | 0.6% |
| Asian | 4.5% | 3.1% | 5.7% |
| Hawaiian | 0.0% | 0.1% | 0.2% |
| Other | 0.4% | 0.4% | 0.4% |
| Two Or More | 3.4% | 3.3% | 3.5% |
| Hispanic | 11.6% | 10.0% | 18.7% |
Gender in Raleigh
Raleigh is 51.2% female with 238,241 female residents.
Raleigh is 48.8% male with 227,275 male residents.
| Gender | Raleigh | NC | USA |
|---|---|---|---|
| Female | 51.2% | 51.0% | 50.4% |
| Male | 48.8% | 49.0% | 49.6% |
Highest level of educational attainment in Raleigh for adults over 25
3.0% of adults in Raleigh completed < 9th grade.
4.0% of adults in Raleigh completed 9-12th grade.
16.0% of adults in Raleigh completed high school / ged.
16.0% of adults in Raleigh completed some college.
7.0% of adults in Raleigh completed associate's degree.
33.0% of adults in Raleigh completed bachelor's degree.
14.0% of adults in Raleigh completed master's degree.
4.0% of adults in Raleigh completed professional degree.
3.0% of adults in Raleigh completed doctorate degree.
| Education | Raleigh | NC | USA |
|---|---|---|---|
| < 9th Grade | 3.0% | 5.0% | 4.0% |
| 9-12th Grade | 4.0% | 7.0% | 6.0% |
| High School / GED | 16.0% | 25.0% | 26.0% |
| Some College | 16.0% | 20.0% | 20.0% |
| Associate's Degree | 7.0% | 10.0% | 9.0% |
| Bachelor's Degree | 33.0% | 21.0% | 21.0% |
| Master's Degree | 14.0% | 9.0% | 10.0% |
| Professional Degree | 4.0% | 2.0% | 2.0% |
| Doctorate Degree | 3.0% | 1.0% | 2.0% |
Household Income For Raleigh, North Carolina
4.4% of households in Raleigh earn Less than $10,000.
2.9% of households in Raleigh earn $10,000 to $14,999.
6.0% of households in Raleigh earn $15,000 to $24,999.
7.1% of households in Raleigh earn $25,000 to $34,999.
10.9% of households in Raleigh earn $35,000 to $49,999.
16.3% of households in Raleigh earn $50,000 to $74,999.
13.0% of households in Raleigh earn $75,000 to $99,999.
17.0% of households in Raleigh earn $100,000 to $149,999.
9.6% of households in Raleigh earn $150,000 to $199,999.
12.8% of households in Raleigh earn $200,000 or more.
| Income | Raleigh | NC | USA |
|---|---|---|---|
| Less than $10,000 | 4.4% | 5.1% | 4.9% |
| $10,000 to $14,999 | 2.9% | 4.3% | 3.8% |
| $15,000 to $24,999 | 6.0% | 8.1% | 7.0% |
| $25,000 to $34,999 | 7.1% | 8.5% | 7.4% |
| $35,000 to $49,999 | 10.9% | 12.3% | 10.7% |
| $50,000 to $74,999 | 16.3% | 17.3% | 16.1% |
| $75,000 to $99,999 | 13.0% | 12.9% | 12.8% |
| $100,000 to $149,999 | 17.0% | 15.9% | 17.1% |
| $150,000 to $199,999 | 9.6% | 7.2% | 8.8% |
| $200,000 or more | 12.8% | 8.5% | 11.4% |


