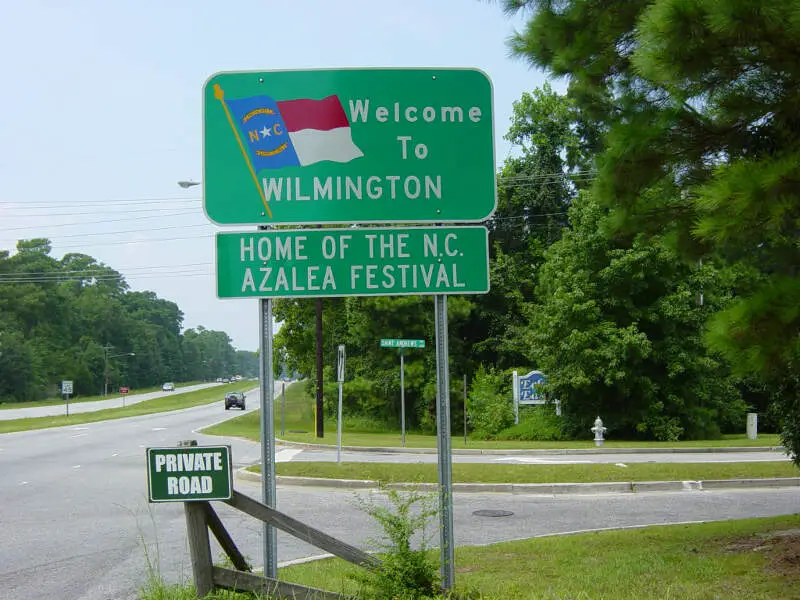
Wilmington, NC
Demographics And Statistics
Living In Wilmington, North Carolina Summary
Life in Wilmington research summary. HomeSnacks has been using Saturday Night Science to research the quality of life in Wilmington over the past nine years using Census, FBI, Zillow, and other primary data sources. Based on the most recently available data, we found the following about life in Wilmington:
The population in Wilmington is 116,933.
The median home value in Wilmington is $390,034.
The median income in Wilmington is $58,908.
The cost of living in Wilmington is 102 which is 1.0x higher than the national average.
The median rent in Wilmington is $1,213.
The unemployment rate in Wilmington is 4.9%.
The poverty rate in Wilmington is 17.8%.
The average high in Wilmington is 73.4° and the average low is 52.5°.
Wilmington SnackAbility
Overall SnackAbility
Wilmington, NC Crime Report
Crime in Wilmington summary. We use data from the FBI to determine the crime rates in Wilmington. Key points include:
There were 4,049 total crimes in Wilmington in the last reporting year.
The overall crime rate per 100,000 people in Wilmington is 3,398.0 / 100k people.
The violent crime rate per 100,000 people in Wilmington is 532.1 / 100k people.
The property crime rate per 100,000 people in Wilmington is 2,865.9 / 100k people.
Overall, crime in Wilmington is 46.20% above the national average.
Total Crimes
Above National Average
Crime In Wilmington Comparison Table
| Statistic | Count Raw |
Wilmington / 100k People |
North Carolina / 100k People |
National / 100k People |
|---|---|---|---|---|
| Total Crimes Per 100K | 4,049 | 3,398.0 | 2,645.8 | 2,324.2 |
| Violent Crime | 634 | 532.1 | 419.3 | 369.8 |
| Murder | 12 | 10.1 | 8.0 | 6.3 |
| Robbery | 111 | 93.2 | 69.2 | 66.1 |
| Aggravated Assault | 434 | 364.2 | 314.5 | 268.2 |
| Property Crime | 3,415 | 2,865.9 | 2,226.5 | 1,954.4 |
| Burglary | 470 | 394.4 | 471.2 | 269.8 |
| Larceny | 2,675 | 2,244.9 | 1,561.7 | 1,401.9 |
| Car Theft | 270 | 226.6 | 193.6 | 282.7 |
Wilmington, NC Cost Of Living
Cost of living in Wilmington summary. We use data on the cost of living to determine how expensive it is to live in Wilmington. Real estate prices drive most of the variance in cost of living around North Carolina. Key points include:
The cost of living in Wilmington is 102 with 100 being average.
The cost of living in Wilmington is 1.0x higher than the national average.
The median home value in Wilmington is $390,034.
The median income in Wilmington is $58,908.
Wilmington's Overall Cost Of Living
Higher Than The National Average
Cost Of Living In Wilmington Comparison Table
| Living Expense | Wilmington | North Carolina | National Average | |
|---|---|---|---|---|
| Overall | 102 | 95 | 100 | |
| Services | 96 | 97 | 100 | |
| Groceries | 90 | 98 | 100 | |
| Health | 103 | 108 | 100 | |
| Housing | 113 | 91 | 100 | |
| Transportation | 97 | 92 | 100 | |
| Utilities | 102 | 95 | 100 | |
Wilmington, NC Weather
The average high in Wilmington is 73.4° and the average low is 52.5°.
There are 77.4 days of precipitation each year.
Expect an average of 57.1 inches of precipitation each year with 1.1 inches of snow.
| Stat | Wilmington |
|---|---|
| Average Annual High | 73.4 |
| Average Annual Low | 52.5 |
| Annual Precipitation Days | 77.4 |
| Average Annual Precipitation | 57.1 |
| Average Annual Snowfall | 1.1 |
Average High
Days of Rain
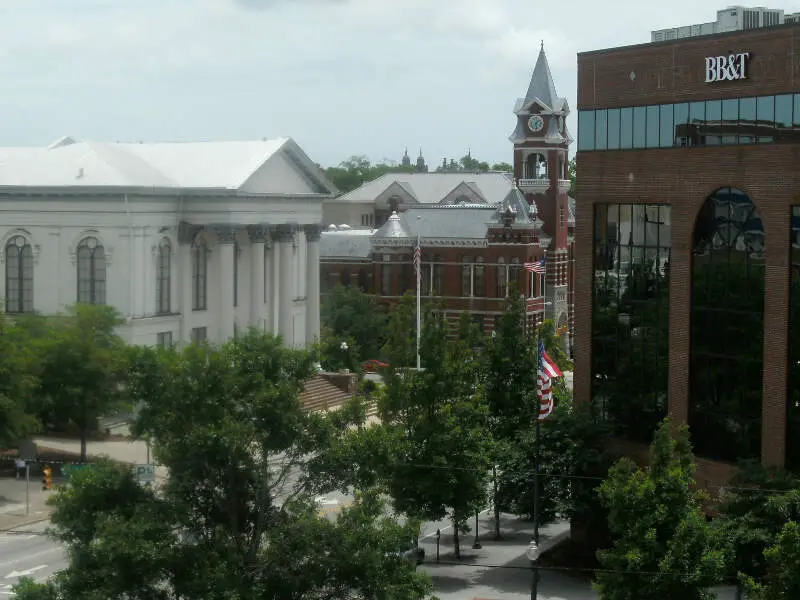
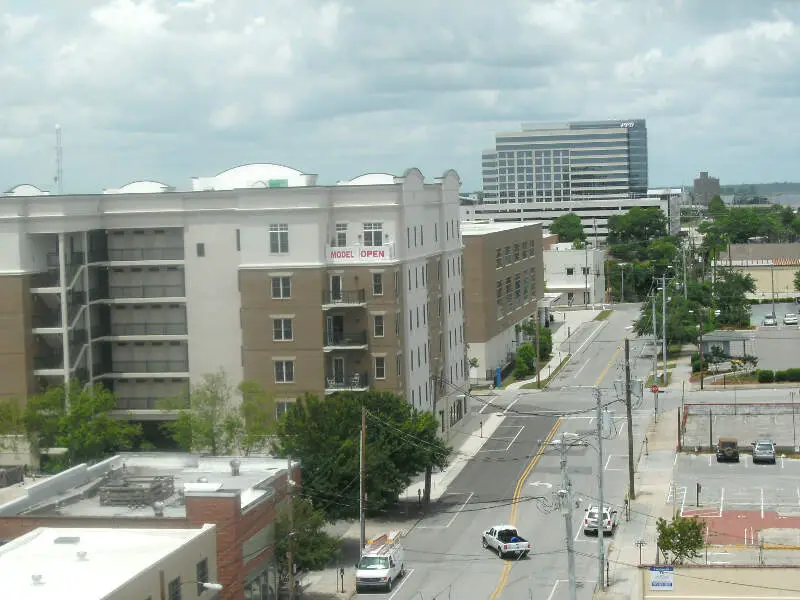
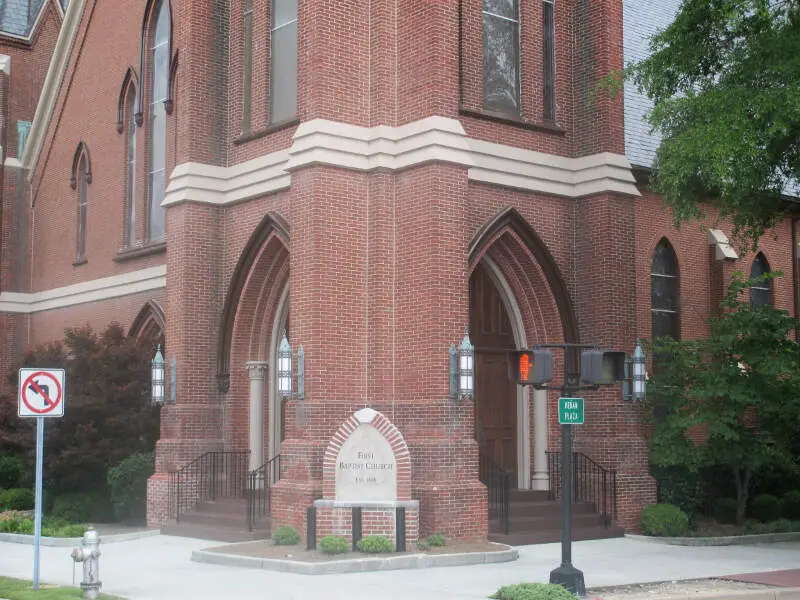
Wilmington, NC Photos


3 Reviews & Comments About Wilmington
/5

Chad Frink -
I was born in Wilmington NC and I've lived in the Appalachian mountains now for about a year. Honestly I miss Wilmington LMAO we had a good mixture of everything on the coast lol
HomeSnacks User - 2018-08-01 14:24:05.036239
Wilmington is a beautiful place with lots to do. There is the river and boardwalk with restaurants and shopping. The beaches are wonderful. So many beautiful parks
My favorite thing was to take the free ferry across to Southport. Also the beaches are spotless they have strict rules on trash and so it's so beautiful and clean.
HomeSnacks User - 2018-09-10 14:19:11.309309
It is a small city but it is very nice to live there, its people are friendly, it has beaches, and beautiful places to visit.
my favorite places, museums for adults and children, water park, parks for children, beaches, and many more attractions.
Rankings for Wilmington in North Carolina


Locations Around Wilmington
Map Of Wilmington, NC
Best Places Around Wilmington
Ogden, NC
Population 8,699
Myrtle Grove, NC
Population 12,093
Porters Neck, NC
Population 7,165
Murraysville, NC
Population 16,672
Silver Lake, NC
Population 5,858
Carolina Beach, NC
Population 6,583
Kings Grant, NC
Population 8,561
Boiling Spring Lakes, NC
Population 6,032
Leland, NC
Population 24,473
Wilmington Demographics And Statistics
Population over time in Wilmington
The current population in Wilmington is 116,933. The population has increased 11.7% from 2010.
| Year | Population | % Change |
|---|---|---|
| 2022 | 116,933 | -1.0% |
| 2021 | 118,094 | 2.5% |
| 2020 | 115,261 | 1.4% |
| 2019 | 113,724 | 1.5% |
| 2018 | 111,998 | 1.7% |
| 2017 | 110,100 | 1.4% |
| 2016 | 108,530 | 1.3% |
| 2015 | 107,116 | 1.1% |
| 2014 | 105,900 | 1.1% |
| 2013 | 104,730 | - |
Race / Ethnicity in Wilmington
Wilmington is:
71.5% White with 83,656 White residents.
16.1% African American with 18,792 African American residents.
0.2% American Indian with 234 American Indian residents.
1.3% Asian with 1,492 Asian residents.
0.0% Hawaiian with 25 Hawaiian residents.
0.6% Other with 712 Other residents.
3.3% Two Or More with 3,832 Two Or More residents.
7.0% Hispanic with 8,190 Hispanic residents.
| Race | Wilmington | NC | USA |
|---|---|---|---|
| White | 71.5% | 61.7% | 58.9% |
| African American | 16.1% | 20.6% | 12.1% |
| American Indian | 0.2% | 0.9% | 0.6% |
| Asian | 1.3% | 3.1% | 5.7% |
| Hawaiian | 0.0% | 0.1% | 0.2% |
| Other | 0.6% | 0.4% | 0.4% |
| Two Or More | 3.3% | 3.3% | 3.5% |
| Hispanic | 7.0% | 10.0% | 18.7% |
Gender in Wilmington
Wilmington is 53.3% female with 62,345 female residents.
Wilmington is 46.7% male with 54,588 male residents.
| Gender | Wilmington | NC | USA |
|---|---|---|---|
| Female | 53.3% | 51.0% | 50.4% |
| Male | 46.7% | 49.0% | 49.6% |
Highest level of educational attainment in Wilmington for adults over 25
3.0% of adults in Wilmington completed < 9th grade.
4.0% of adults in Wilmington completed 9-12th grade.
20.0% of adults in Wilmington completed high school / ged.
19.0% of adults in Wilmington completed some college.
11.0% of adults in Wilmington completed associate's degree.
28.0% of adults in Wilmington completed bachelor's degree.
10.0% of adults in Wilmington completed master's degree.
3.0% of adults in Wilmington completed professional degree.
2.0% of adults in Wilmington completed doctorate degree.
| Education | Wilmington | NC | USA |
|---|---|---|---|
| < 9th Grade | 3.0% | 5.0% | 4.0% |
| 9-12th Grade | 4.0% | 7.0% | 6.0% |
| High School / GED | 20.0% | 25.0% | 26.0% |
| Some College | 19.0% | 20.0% | 20.0% |
| Associate's Degree | 11.0% | 10.0% | 9.0% |
| Bachelor's Degree | 28.0% | 21.0% | 21.0% |
| Master's Degree | 10.0% | 9.0% | 10.0% |
| Professional Degree | 3.0% | 2.0% | 2.0% |
| Doctorate Degree | 2.0% | 1.0% | 2.0% |
Household Income For Wilmington, North Carolina
7.9% of households in Wilmington earn Less than $10,000.
4.8% of households in Wilmington earn $10,000 to $14,999.
8.4% of households in Wilmington earn $15,000 to $24,999.
8.3% of households in Wilmington earn $25,000 to $34,999.
12.3% of households in Wilmington earn $35,000 to $49,999.
18.7% of households in Wilmington earn $50,000 to $74,999.
11.0% of households in Wilmington earn $75,000 to $99,999.
14.0% of households in Wilmington earn $100,000 to $149,999.
5.8% of households in Wilmington earn $150,000 to $199,999.
8.8% of households in Wilmington earn $200,000 or more.
| Income | Wilmington | NC | USA |
|---|---|---|---|
| Less than $10,000 | 7.9% | 5.1% | 4.9% |
| $10,000 to $14,999 | 4.8% | 4.3% | 3.8% |
| $15,000 to $24,999 | 8.4% | 8.1% | 7.0% |
| $25,000 to $34,999 | 8.3% | 8.5% | 7.4% |
| $35,000 to $49,999 | 12.3% | 12.3% | 10.7% |
| $50,000 to $74,999 | 18.7% | 17.3% | 16.1% |
| $75,000 to $99,999 | 11.0% | 12.9% | 12.8% |
| $100,000 to $149,999 | 14.0% | 15.9% | 17.1% |
| $150,000 to $199,999 | 5.8% | 7.2% | 8.8% |
| $200,000 or more | 8.8% | 8.5% | 11.4% |


