Alliance, NE
Demographics And Statistics
Living In Alliance, Nebraska Summary
Life in Alliance research summary. HomeSnacks has been using Saturday Night Science to research the quality of life in Alliance over the past nine years using Census, FBI, Zillow, and other primary data sources. Based on the most recently available data, we found the following about life in Alliance:
The population in Alliance is 8,118.
The median home value in Alliance is $153,789.
The median income in Alliance is $58,214.
The cost of living in Alliance is 85 which is 0.8x lower than the national average.
The median rent in Alliance is $728.
The unemployment rate in Alliance is 5.4%.
The poverty rate in Alliance is 13.8%.
The average high in Alliance is 61.6° and the average low is 33.6°.
Alliance SnackAbility
Overall SnackAbility
Alliance, NE Crime Report
Crime in Alliance summary. We use data from the FBI to determine the crime rates in Alliance. Key points include:
There were 168 total crimes in Alliance in the last reporting year.
The overall crime rate per 100,000 people in Alliance is 2,151.9 / 100k people.
The violent crime rate per 100,000 people in Alliance is 473.9 / 100k people.
The property crime rate per 100,000 people in Alliance is 1,678.0 / 100k people.
Overall, crime in Alliance is -7.41% below the national average.
Total Crimes
Below National Average
Crime In Alliance Comparison Table
| Statistic | Count Raw |
Alliance / 100k People |
Nebraska / 100k People |
National / 100k People |
|---|---|---|---|---|
| Total Crimes Per 100K | 168 | 2,151.9 | 2,243.2 | 2,324.2 |
| Violent Crime | 37 | 473.9 | 334.1 | 369.8 |
| Murder | 0 | 0.0 | 3.6 | 6.3 |
| Robbery | 1 | 12.8 | 41.2 | 66.1 |
| Aggravated Assault | 32 | 409.9 | 229.3 | 268.2 |
| Property Crime | 131 | 1,678.0 | 1,909.2 | 1,954.4 |
| Burglary | 17 | 217.8 | 229.9 | 269.8 |
| Larceny | 105 | 1,344.9 | 1,418.7 | 1,401.9 |
| Car Theft | 9 | 115.3 | 260.5 | 282.7 |
Alliance, NE Cost Of Living
Cost of living in Alliance summary. We use data on the cost of living to determine how expensive it is to live in Alliance. Real estate prices drive most of the variance in cost of living around Nebraska. Key points include:
The cost of living in Alliance is 85 with 100 being average.
The cost of living in Alliance is 0.8x lower than the national average.
The median home value in Alliance is $153,789.
The median income in Alliance is $58,214.
Alliance's Overall Cost Of Living
Lower Than The National Average
Cost Of Living In Alliance Comparison Table
| Living Expense | Alliance | Nebraska | National Average | |
|---|---|---|---|---|
| Overall | 85 | 91 | 100 | |
| Services | 96 | 95 | 100 | |
| Groceries | 106 | 96 | 100 | |
| Health | 95 | 99 | 100 | |
| Housing | 53 | 80 | 100 | |
| Transportation | 99 | 99 | 100 | |
| Utilities | 81 | 86 | 100 | |
Alliance, NE Weather
The average high in Alliance is 61.6° and the average low is 33.6°.
There are 36.4 days of precipitation each year.
Expect an average of 15.0 inches of precipitation each year with 38.8 inches of snow.
| Stat | Alliance |
|---|---|
| Average Annual High | 61.6 |
| Average Annual Low | 33.6 |
| Annual Precipitation Days | 36.4 |
| Average Annual Precipitation | 15.0 |
| Average Annual Snowfall | 38.8 |
Average High
Days of Rain
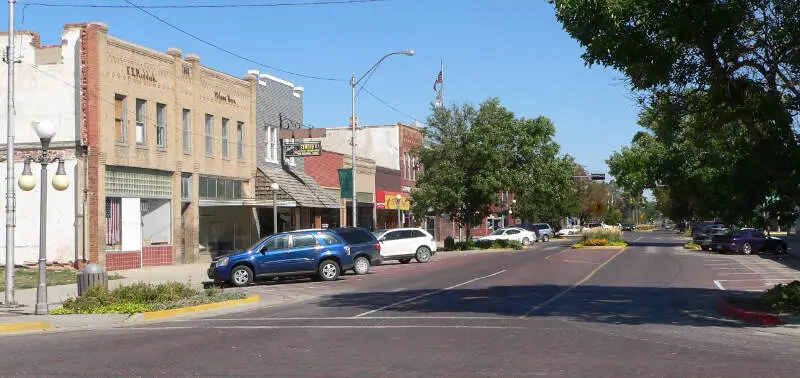
Alliance, NE Photos

1 Reviews & Comments About Alliance
/5

HomeSnacks User -
When I moved to Alliance in 1987 thought there would be a tree lighting ceremony around Christmas or community events around the holidays. But instead I found a town that has a high drug rate and crime rate.
I saw children grow up who had such potential turn into addicts.
Rankings for Alliance in Nebraska


Locations Around Alliance
Map Of Alliance, NE
Alliance Demographics And Statistics
Population over time in Alliance
The current population in Alliance is 8,118. The population has decreased -4.8% from 2010.
| Year | Population | % Change |
|---|---|---|
| 2022 | 8,118 | -2.3% |
| 2021 | 8,313 | -0.9% |
| 2020 | 8,392 | -0.9% |
| 2019 | 8,469 | -0.4% |
| 2018 | 8,500 | -0.0% |
| 2017 | 8,501 | 0.0% |
| 2016 | 8,501 | -0.2% |
| 2015 | 8,516 | -0.2% |
| 2014 | 8,531 | 0.1% |
| 2013 | 8,524 | - |
Race / Ethnicity in Alliance
Alliance is:
79.7% White with 6,467 White residents.
4.5% African American with 365 African American residents.
2.6% American Indian with 211 American Indian residents.
0.8% Asian with 65 Asian residents.
0.0% Hawaiian with 0 Hawaiian residents.
0.0% Other with 0 Other residents.
0.6% Two Or More with 49 Two Or More residents.
11.8% Hispanic with 961 Hispanic residents.
| Race | Alliance | NE | USA |
|---|---|---|---|
| White | 79.7% | 77.1% | 58.9% |
| African American | 4.5% | 4.7% | 12.1% |
| American Indian | 2.6% | 0.6% | 0.6% |
| Asian | 0.8% | 2.5% | 5.7% |
| Hawaiian | 0.0% | 0.1% | 0.2% |
| Other | 0.0% | 0.3% | 0.4% |
| Two Or More | 0.6% | 3.1% | 3.5% |
| Hispanic | 11.8% | 11.8% | 18.7% |
Gender in Alliance
Alliance is 49.5% female with 4,020 female residents.
Alliance is 50.5% male with 4,098 male residents.
| Gender | Alliance | NE | USA |
|---|---|---|---|
| Female | 49.5% | 49.7% | 50.4% |
| Male | 50.5% | 50.3% | 49.6% |
Highest level of educational attainment in Alliance for adults over 25
3.0% of adults in Alliance completed < 9th grade.
5.0% of adults in Alliance completed 9-12th grade.
29.0% of adults in Alliance completed high school / ged.
32.0% of adults in Alliance completed some college.
12.0% of adults in Alliance completed associate's degree.
16.0% of adults in Alliance completed bachelor's degree.
2.0% of adults in Alliance completed master's degree.
1.0% of adults in Alliance completed professional degree.
0.0% of adults in Alliance completed doctorate degree.
| Education | Alliance | NE | USA |
|---|---|---|---|
| < 9th Grade | 3.0% | 5.0% | 4.0% |
| 9-12th Grade | 5.0% | 4.0% | 6.0% |
| High School / GED | 29.0% | 25.0% | 26.0% |
| Some College | 32.0% | 22.0% | 20.0% |
| Associate's Degree | 12.0% | 11.0% | 9.0% |
| Bachelor's Degree | 16.0% | 22.0% | 21.0% |
| Master's Degree | 2.0% | 8.0% | 10.0% |
| Professional Degree | 1.0% | 2.0% | 2.0% |
| Doctorate Degree | 0.0% | 1.0% | 2.0% |
Household Income For Alliance, Nebraska
8.5% of households in Alliance earn Less than $10,000.
3.0% of households in Alliance earn $10,000 to $14,999.
10.9% of households in Alliance earn $15,000 to $24,999.
8.3% of households in Alliance earn $25,000 to $34,999.
11.6% of households in Alliance earn $35,000 to $49,999.
18.1% of households in Alliance earn $50,000 to $74,999.
15.6% of households in Alliance earn $75,000 to $99,999.
18.0% of households in Alliance earn $100,000 to $149,999.
5.3% of households in Alliance earn $150,000 to $199,999.
0.8% of households in Alliance earn $200,000 or more.
| Income | Alliance | NE | USA |
|---|---|---|---|
| Less than $10,000 | 8.5% | 4.2% | 4.9% |
| $10,000 to $14,999 | 3.0% | 3.5% | 3.8% |
| $15,000 to $24,999 | 10.9% | 7.0% | 7.0% |
| $25,000 to $34,999 | 8.3% | 7.9% | 7.4% |
| $35,000 to $49,999 | 11.6% | 11.6% | 10.7% |
| $50,000 to $74,999 | 18.1% | 17.8% | 16.1% |
| $75,000 to $99,999 | 15.6% | 13.8% | 12.8% |
| $100,000 to $149,999 | 18.0% | 18.1% | 17.1% |
| $150,000 to $199,999 | 5.3% | 8.1% | 8.8% |
| $200,000 or more | 0.8% | 7.8% | 11.4% |


