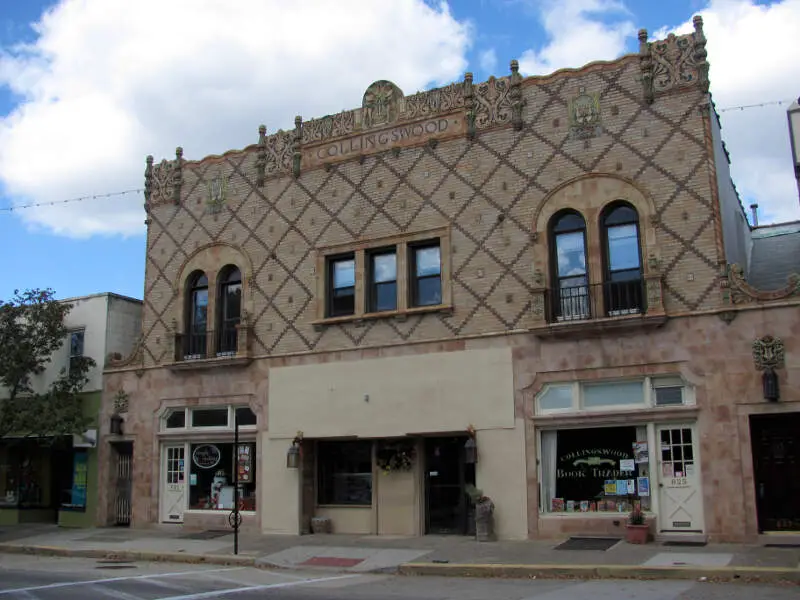
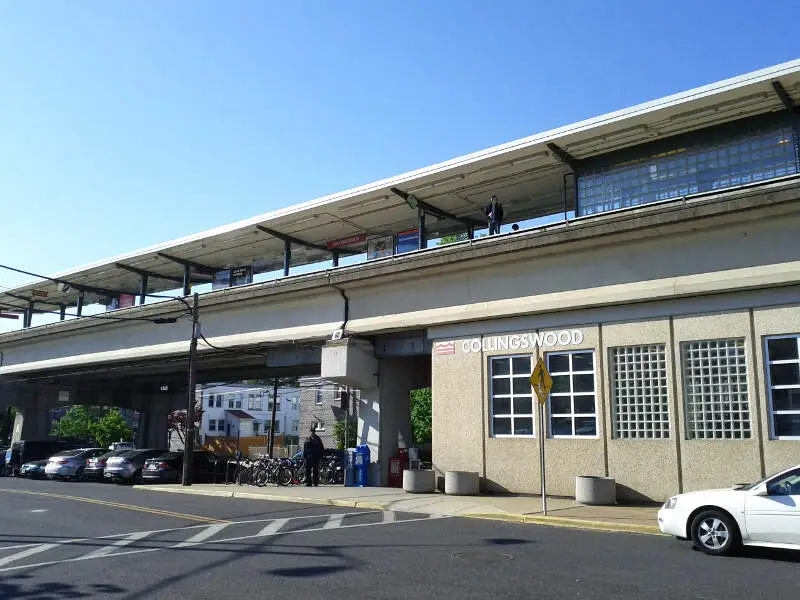
Collingswood, NJ
Demographics And Statistics
Living In Collingswood, New Jersey Summary
Life in Collingswood research summary. HomeSnacks has been using Saturday Night Science to research the quality of life in Collingswood over the past nine years using Census, FBI, Zillow, and other primary data sources. Based on the most recently available data, we found the following about life in Collingswood:
The population in Collingswood is 14,135.
The median home value in Collingswood is $389,070.
The median income in Collingswood is $78,909.
The cost of living in Collingswood is 114 which is 1.1x higher than the national average.
The median rent in Collingswood is $1,247.
The unemployment rate in Collingswood is 8.1%.
The poverty rate in Collingswood is 11.8%.
The average high in Collingswood is 65.0° and the average low is 47.6°.
Collingswood SnackAbility
Overall SnackAbility
Collingswood, NJ Crime Report
Crime in Collingswood summary. We use data from the FBI to determine the crime rates in Collingswood. Key points include:
There were 458 total crimes in Collingswood in the last reporting year.
The overall crime rate per 100,000 people in Collingswood is 3,246.4 / 100k people.
The violent crime rate per 100,000 people in Collingswood is 219.7 / 100k people.
The property crime rate per 100,000 people in Collingswood is 3,026.7 / 100k people.
Overall, crime in Collingswood is 39.68% above the national average.
Total Crimes
Above National Average
Crime In Collingswood Comparison Table
| Statistic | Count Raw |
Collingswood / 100k People |
New Jersey / 100k People |
National / 100k People |
|---|---|---|---|---|
| Total Crimes Per 100K | 458 | 3,246.4 | 1,353.6 | 2,324.2 |
| Violent Crime | 31 | 219.7 | 195.4 | 369.8 |
| Murder | 0 | 0.0 | 3.7 | 6.3 |
| Robbery | 6 | 42.5 | 49.4 | 66.1 |
| Aggravated Assault | 25 | 177.2 | 127.9 | 268.2 |
| Property Crime | 427 | 3,026.7 | 1,158.2 | 1,954.4 |
| Burglary | 91 | 645.0 | 146.2 | 269.8 |
| Larceny | 315 | 2,232.8 | 896.3 | 1,401.9 |
| Car Theft | 21 | 148.9 | 115.7 | 282.7 |
Collingswood, NJ Cost Of Living
Cost of living in Collingswood summary. We use data on the cost of living to determine how expensive it is to live in Collingswood. Real estate prices drive most of the variance in cost of living around New Jersey. Key points include:
The cost of living in Collingswood is 114 with 100 being average.
The cost of living in Collingswood is 1.1x higher than the national average.
The median home value in Collingswood is $389,070.
The median income in Collingswood is $78,909.
Collingswood's Overall Cost Of Living
Higher Than The National Average
Cost Of Living In Collingswood Comparison Table
| Living Expense | Collingswood | New Jersey | National Average | |
|---|---|---|---|---|
| Overall | 114 | 111 | 100 | |
| Services | 101 | 104 | 100 | |
| Groceries | 117 | 104 | 100 | |
| Health | 98 | 95 | 100 | |
| Housing | 130 | 130 | 100 | |
| Transportation | 110 | 106 | 100 | |
| Utilities | 113 | 108 | 100 | |
Collingswood, NJ Weather
The average high in Collingswood is 65.0° and the average low is 47.6°.
There are 80.1 days of precipitation each year.
Expect an average of 46.5 inches of precipitation each year with 12.0 inches of snow.
| Stat | Collingswood |
|---|---|
| Average Annual High | 65.0 |
| Average Annual Low | 47.6 |
| Annual Precipitation Days | 80.1 |
| Average Annual Precipitation | 46.5 |
| Average Annual Snowfall | 12.0 |
Average High
Days of Rain
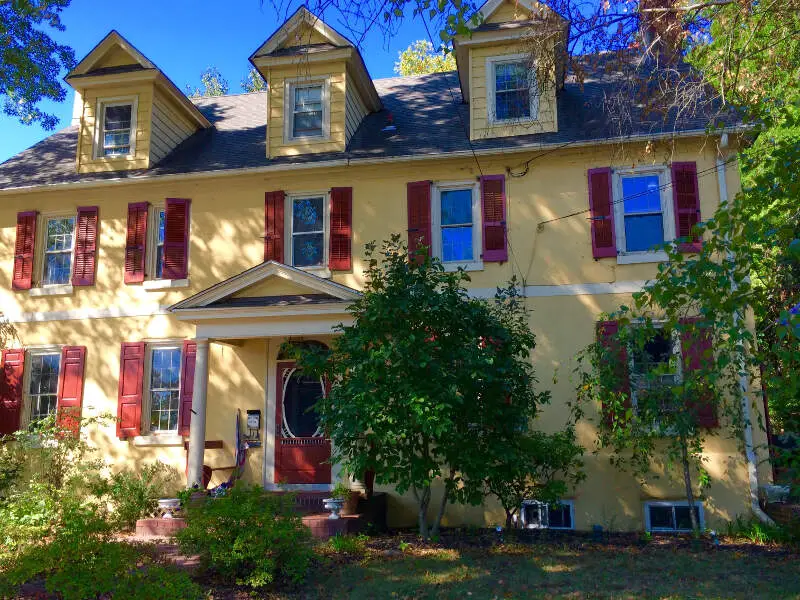
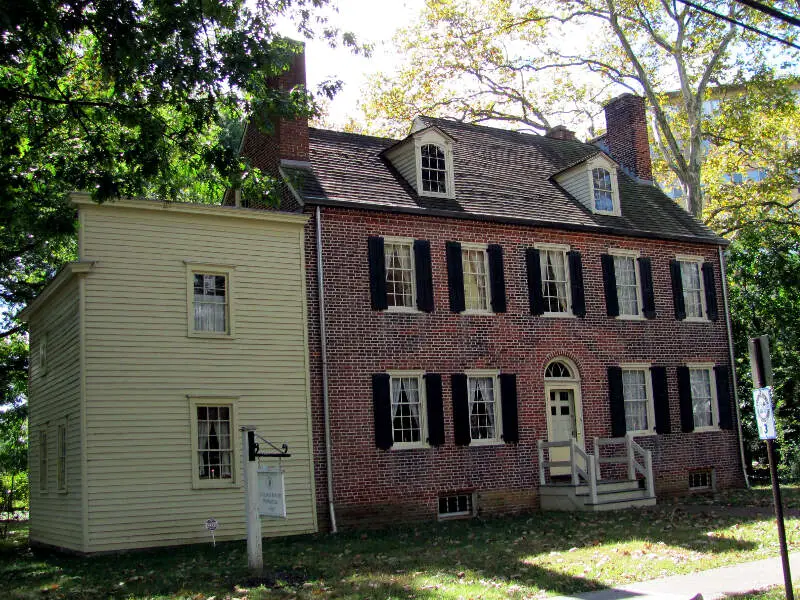
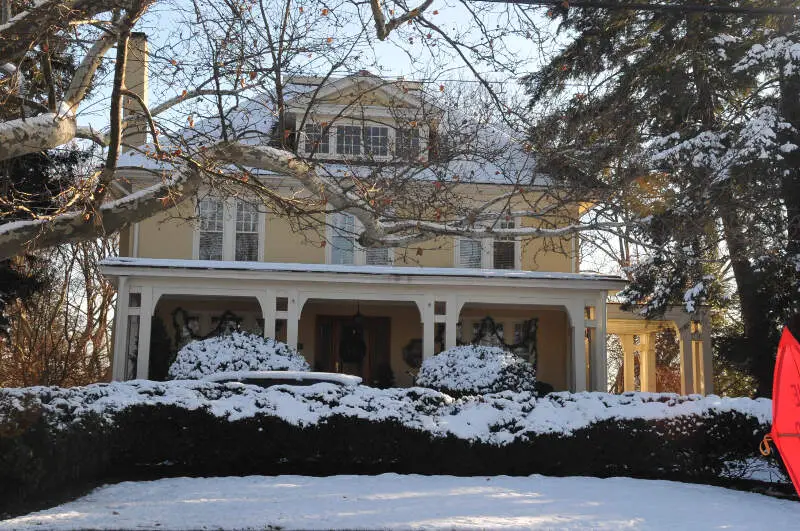
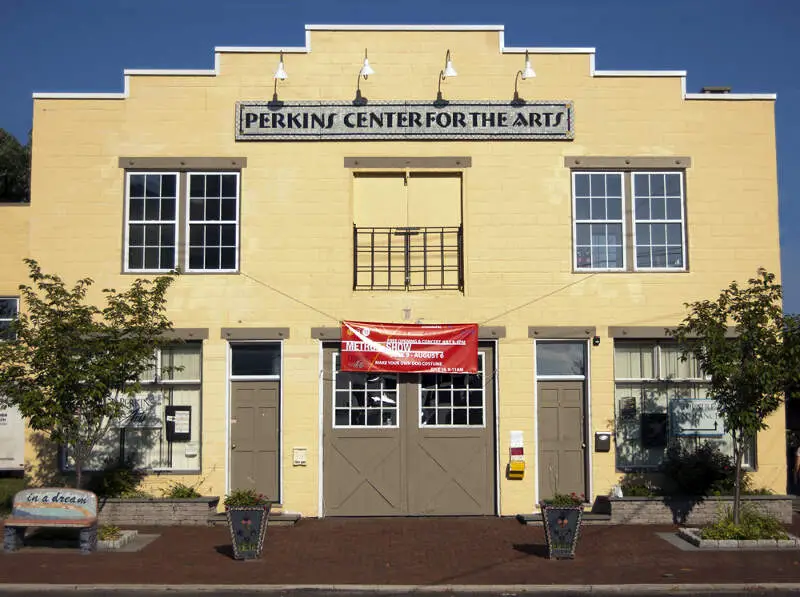
Collingswood, NJ Photos
Rankings for Collingswood in New Jersey


Locations Around Collingswood
Map Of Collingswood, NJ
Best Places Around Collingswood
Ashland, NJ
Population 9,383
Springdale, NJ
Population 15,247
Ramblewood, NJ
Population 6,320
Greentree, NJ
Population 11,016
Penn Wynne, PA
Population 6,127
Oreland, PA
Population 6,123
Glenside, PA
Population 7,726
Wyndmoor, PA
Population 5,698
Maple Glen, PA
Population 6,637
Ardmore, PA
Population 14,075
Collingswood Demographics And Statistics
Population over time in Collingswood
The current population in Collingswood is 14,135. The population has increased 0.8% from 2010.
| Year | Population | % Change |
|---|---|---|
| 2022 | 14,135 | 1.6% |
| 2021 | 13,912 | -0.4% |
| 2020 | 13,969 | 0.3% |
| 2019 | 13,925 | 0.0% |
| 2018 | 13,925 | -0.0% |
| 2017 | 13,929 | 0.1% |
| 2016 | 13,914 | -0.1% |
| 2015 | 13,923 | -0.4% |
| 2014 | 13,983 | -0.3% |
| 2013 | 14,024 | - |
Race / Ethnicity in Collingswood
Collingswood is:
77.5% White with 10,952 White residents.
12.2% African American with 1,719 African American residents.
0.1% American Indian with 11 American Indian residents.
1.1% Asian with 155 Asian residents.
0.0% Hawaiian with 0 Hawaiian residents.
0.1% Other with 10 Other residents.
2.7% Two Or More with 381 Two Or More residents.
6.4% Hispanic with 907 Hispanic residents.
| Race | Collingswood | NJ | USA |
|---|---|---|---|
| White | 77.5% | 53.0% | 58.9% |
| African American | 12.2% | 12.4% | 12.1% |
| American Indian | 0.1% | 0.1% | 0.6% |
| Asian | 1.1% | 9.8% | 5.7% |
| Hawaiian | 0.0% | 0.0% | 0.2% |
| Other | 0.1% | 0.7% | 0.4% |
| Two Or More | 2.7% | 2.8% | 3.5% |
| Hispanic | 6.4% | 21.2% | 18.7% |
Gender in Collingswood
Collingswood is 51.4% female with 7,261 female residents.
Collingswood is 48.6% male with 6,873 male residents.
| Gender | Collingswood | NJ | USA |
|---|---|---|---|
| Female | 51.4% | 50.7% | 50.4% |
| Male | 48.6% | 49.3% | 49.6% |
Highest level of educational attainment in Collingswood for adults over 25
0.0% of adults in Collingswood completed < 9th grade.
3.0% of adults in Collingswood completed 9-12th grade.
22.0% of adults in Collingswood completed high school / ged.
17.0% of adults in Collingswood completed some college.
8.0% of adults in Collingswood completed associate's degree.
26.0% of adults in Collingswood completed bachelor's degree.
17.0% of adults in Collingswood completed master's degree.
4.0% of adults in Collingswood completed professional degree.
3.0% of adults in Collingswood completed doctorate degree.
| Education | Collingswood | NJ | USA |
|---|---|---|---|
| < 9th Grade | 0.0% | 4.0% | 4.0% |
| 9-12th Grade | 3.0% | 5.0% | 6.0% |
| High School / GED | 22.0% | 26.0% | 26.0% |
| Some College | 17.0% | 16.0% | 20.0% |
| Associate's Degree | 8.0% | 7.0% | 9.0% |
| Bachelor's Degree | 26.0% | 25.0% | 21.0% |
| Master's Degree | 17.0% | 12.0% | 10.0% |
| Professional Degree | 4.0% | 3.0% | 2.0% |
| Doctorate Degree | 3.0% | 2.0% | 2.0% |
Household Income For Collingswood, New Jersey
3.9% of households in Collingswood earn Less than $10,000.
5.0% of households in Collingswood earn $10,000 to $14,999.
9.4% of households in Collingswood earn $15,000 to $24,999.
8.6% of households in Collingswood earn $25,000 to $34,999.
6.6% of households in Collingswood earn $35,000 to $49,999.
14.8% of households in Collingswood earn $50,000 to $74,999.
12.4% of households in Collingswood earn $75,000 to $99,999.
15.4% of households in Collingswood earn $100,000 to $149,999.
10.1% of households in Collingswood earn $150,000 to $199,999.
13.7% of households in Collingswood earn $200,000 or more.
| Income | Collingswood | NJ | USA |
|---|---|---|---|
| Less than $10,000 | 3.9% | 4.1% | 4.9% |
| $10,000 to $14,999 | 5.0% | 3.0% | 3.8% |
| $15,000 to $24,999 | 9.4% | 5.4% | 7.0% |
| $25,000 to $34,999 | 8.6% | 5.7% | 7.4% |
| $35,000 to $49,999 | 6.6% | 8.2% | 10.7% |
| $50,000 to $74,999 | 14.8% | 13.2% | 16.1% |
| $75,000 to $99,999 | 12.4% | 11.6% | 12.8% |
| $100,000 to $149,999 | 15.4% | 18.0% | 17.1% |
| $150,000 to $199,999 | 10.1% | 11.5% | 8.8% |
| $200,000 or more | 13.7% | 19.2% | 11.4% |


