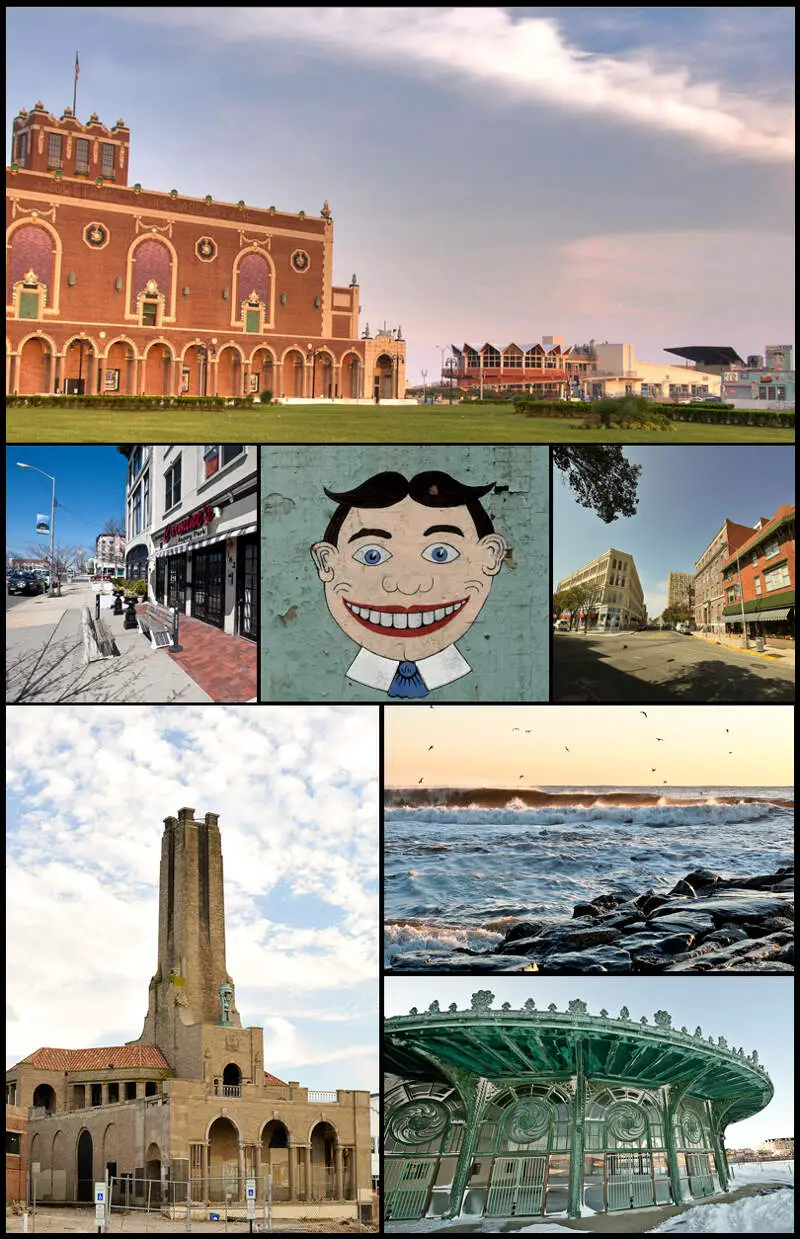

Life in Monmouth County research summary. HomeSnacks has been researching the quality of life in Monmouth County over the past eight years using Census data, FBI crime data, cost of living data, and other primary sources. Based on the most recently available data, we found the following about life in Monmouth County:
The population in Monmouth County is 643,064.
The median home value in Monmouth County is $656,805.
The median income in Monmouth County is $118,527.
The median rent in Monmouth County is $1,683.
The unemployment rate in Monmouth County is 5.4%.
The poverty rate in Monmouth County is 6.4%.
The average high in Monmouth County is 65.6° and there are 107.5 inches of rainfall annually.
The average high in Monmouth County is 65.6°.
There are 86.83 nice days each year.
Expect an average of 107.5 inches of rain each year with 8.8 inches of snow.
There is an average of 4:59 hours of sun each day in Monmouth County.
| Stat | Monmouth County |
|---|---|
| Mean High | 65.6 |
| Nice Days | 86.83 |
| Rainfall | 107.5 |
| Snowfall | 8.8 |
| Sunny_hours | 4:59 |

The current population in Monmouth County is 643,064. The population has increased 3.3% from 2019.
| Year | Population | % Change |
|---|---|---|
| 2022 | 642,160 | 3.4% |
| 2021 | 620,821 | -0.1% |
| 2020 | 621,659 | - |
Monmouth County is 50.9% female with 327,322 female residents.
Monmouth County is 49.1% male with 315,742 male residents.
| Gender | Monmouth County | NJ | USA |
|---|---|---|---|
| Female | 50.9% | 50.7% | 50.4% |
| Male | 49.1% | 49.3% | 49.6% |
Monmouth County is:
73.7% White with 474,258 White residents.
6.2% African American with 40,138 African American residents.
0.0% American Indian with 113 American Indian residents.
5.4% Asian with 34,593 Asian residents.
0.0% Hawaiian with 241 Hawaiian residents.
0.5% Other with 3,493 Other residents.
2.8% Two Or More with 17,809 Two Or More residents.
11.3% Hispanic with 72,419 Hispanic residents.
| Race | Monmouth County | NJ | USA |
|---|---|---|---|
| White | 73.7% | 53.0% | 58.9% |
| African American | 6.2% | 12.4% | 12.1% |
| American Indian | 0.0% | 0.1% | 0.6% |
| Asian | 5.4% | 9.8% | 5.7% |
| Hawaiian | 0.0% | 0.0% | 0.2% |
| Other | 0.5% | 0.7% | 0.4% |
| Two Or More | 2.8% | 2.8% | 3.5% |
| Hispanic | 11.3% | 21.2% | 18.7% |
3.4% of households in Monmouth County earn Less than $10,000.
2.2% of households in Monmouth County earn $10,000 to $14,999.
4.6% of households in Monmouth County earn $15,000 to $24,999.
4.7% of households in Monmouth County earn $25,000 to $34,999.
6.7% of households in Monmouth County earn $35,000 to $49,999.
10.6% of households in Monmouth County earn $50,000 to $74,999.
10.5% of households in Monmouth County earn $75,000 to $99,999.
18.0% of households in Monmouth County earn $100,000 to $149,999.
13.4% of households in Monmouth County earn $150,000 to $199,999.
26.0% of households in Monmouth County earn $200,000 or more.
| Income | Monmouth County | NJ | USA |
|---|---|---|---|
| Less than $10,000 | 3.4% | 4.1% | 4.9% |
| $10,000 to $14,999 | 2.2% | 3.0% | 3.8% |
| $15,000 to $24,999 | 4.6% | 5.4% | 7.0% |
| $25,000 to $34,999 | 4.7% | 5.7% | 7.4% |
| $35,000 to $49,999 | 6.7% | 8.2% | 10.7% |
| $50,000 to $74,999 | 10.6% | 13.2% | 16.1% |
| $75,000 to $99,999 | 10.5% | 11.6% | 12.8% |
| $100,000 to $149,999 | 18.0% | 18.0% | 17.1% |
| $150,000 to $199,999 | 13.4% | 11.5% | 8.8% |
| $200,000 or more | 26.0% | 19.2% | 11.4% |
2.0% of adults in Monmouth County completed < 9th grade.
3.0% of adults in Monmouth County completed 9-12th grade.
21.0% of adults in Monmouth County completed high school / ged.
16.0% of adults in Monmouth County completed some college.
8.0% of adults in Monmouth County completed associate's degree.
30.0% of adults in Monmouth County completed bachelor's degree.
14.0% of adults in Monmouth County completed master's degree.
4.0% of adults in Monmouth County completed professional degree.
2.0% of adults in Monmouth County completed doctorate degree.
| Education | Monmouth County | NJ | USA |
|---|---|---|---|
| < 9th Grade | 2% | 3% | 3% |
| 9-12th Grade | 3% | 5% | 6% |
| High School / GED | 21% | 26% | 26% |
| Some College | 16% | 16% | 20% |
| Associate's Degree | 8% | 7% | 9% |
| Bachelor's Degree | 30% | 25% | 21% |
| Master's Degree | 14% | 12% | 10% |
| Professional Degree | 4% | 3% | 2% |
| Doctorate Degree | 2% | 2% | 2% |
HomeSnacks is based in Durham, NC.
We aim to deliver bite-sized pieces of infotainment about where you live.
We use data, analytics, and a sense of humor to determine quality of life for places across the nation.